High-resolution viewer
Launch
Open a terminal or command prompt (
PowerShellon Windows) in the folder where you extracted the project files. Example forC:\palm-tracer. Open the terminal and type the following command:cd C:\palm_tracer, then press Enter.Make sure the virtual environment is activated if you use it.
Launch Napari with the command:
napari
Note
If you did not create a virtual environment, Napari can be launched from anywhere.
Enable the plugin in Napari:
Note
It is also possible to launch Napari directly with the plugin using the command: napari -w palm-tracer
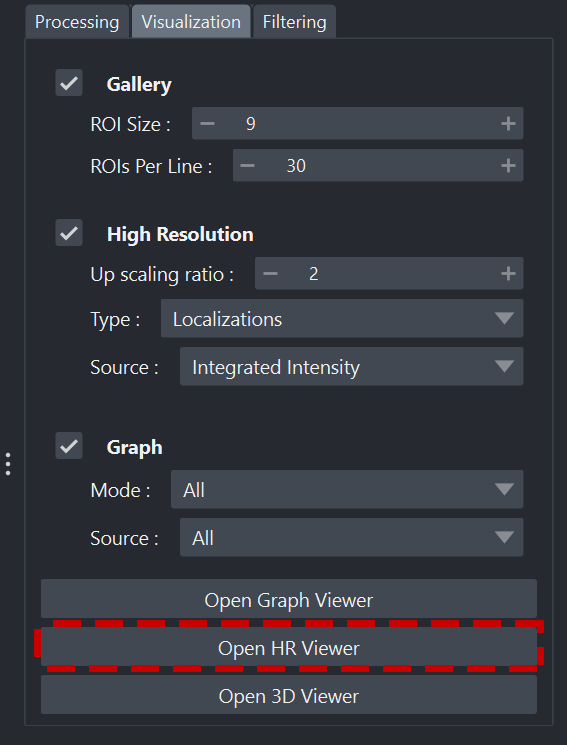
In the Visualization tab of PALM Tracer, there is a button to launch the plots viewer: Open HR Viewer. It is also possible to open it directly from the Napari menu:
Launching the viewer
Interface organization
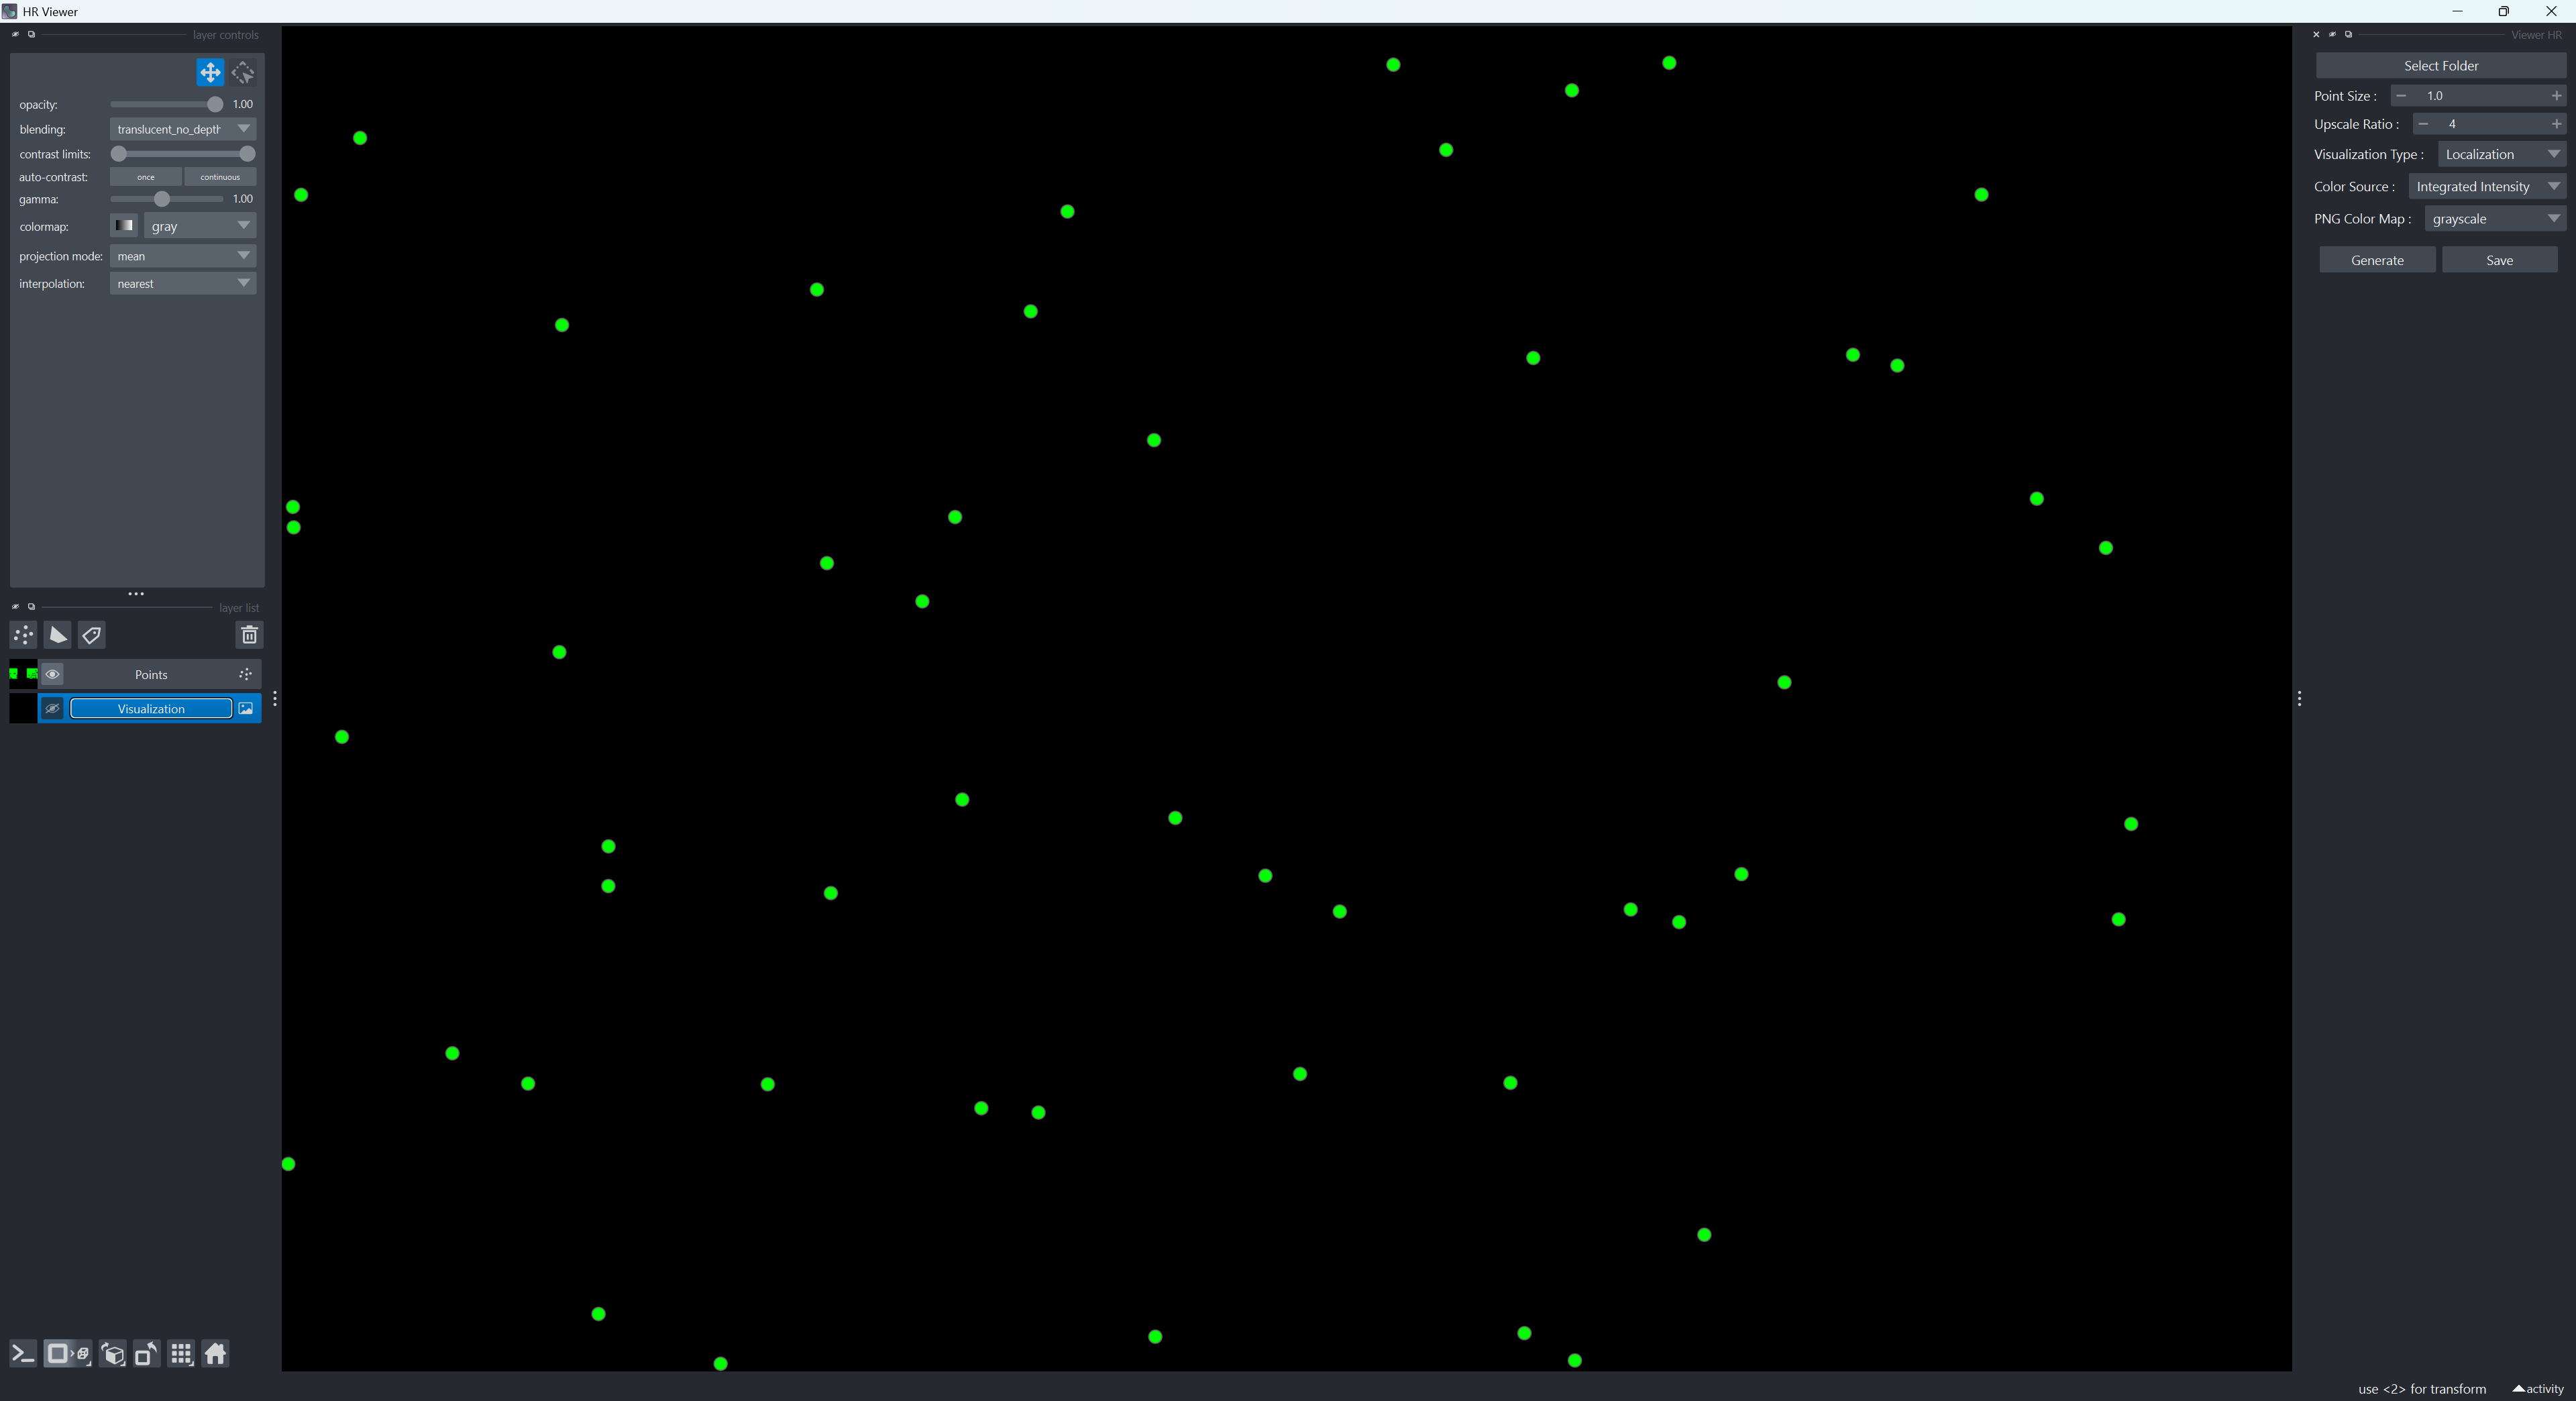
Overview of Napari with the Viewer HR widget
The Napari interface with the high-resolution viewer is organized into three main panels:
On the left: the Layers panel
In the center: the viewer window
On the right: the viewer widget
Layers panel
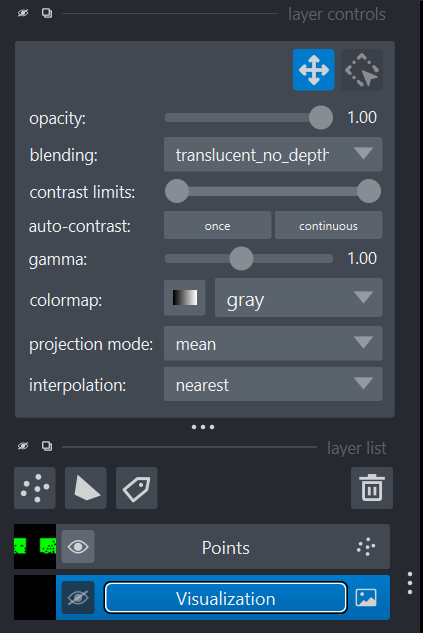
Napari Layers panel
The Layers panel is the area where all visual elements generated by the widget for Napari appear:
Generated high-resolution image
Detected points or trajectories (stored in floating-point precision and zoomable infinitely)
Main features:
Show / hide a layer
Change the transparency
Change the colormap
Reorder layers
Viewer panel
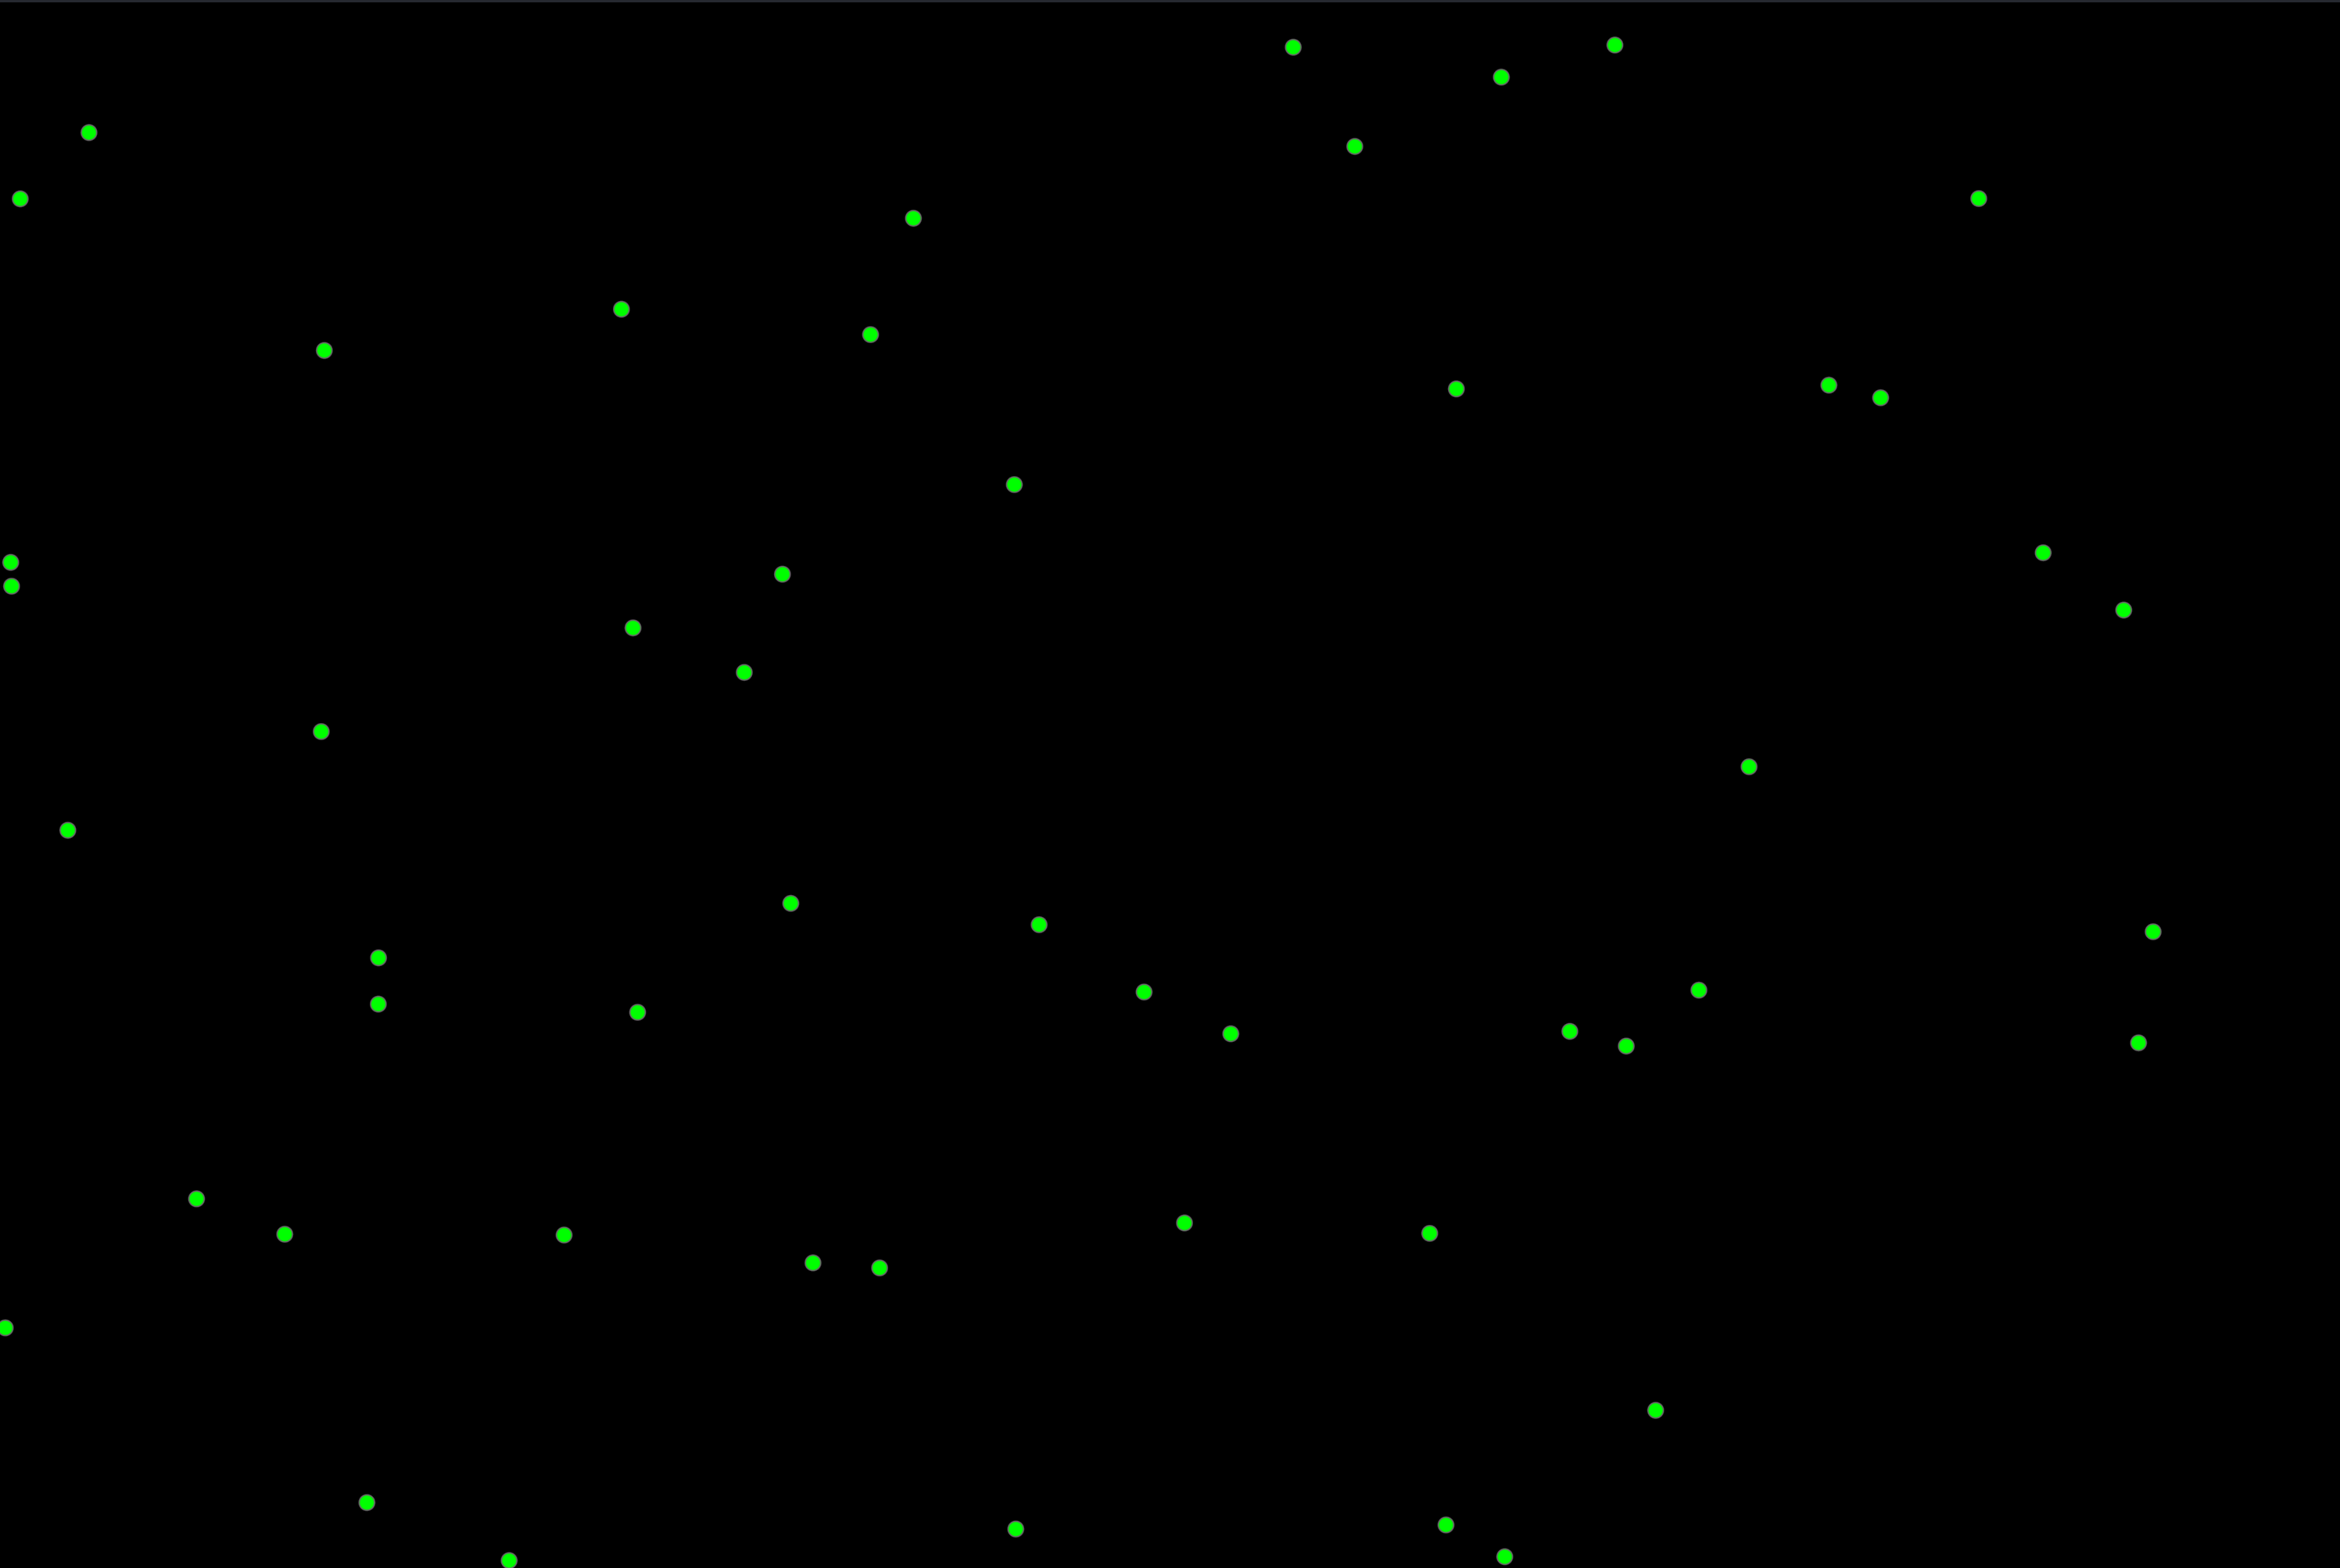
Napari viewer panel
The central area of Napari displays the data. You can:
Zoom (mouse wheel)
Move around (hold left click)
Change the Z plane using the dimension slider (for trajectories)
Adjust the contrast
This area is automatically updated each time you press the Generate button.
Widget panel
Napari Widget panel
The right panel contains the viewer’s main widget.
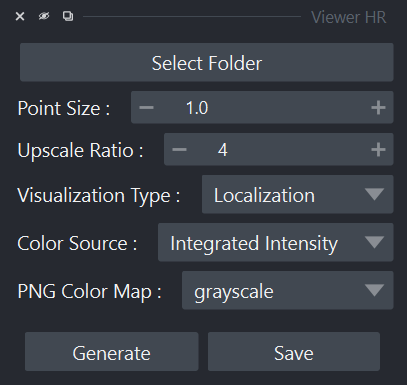
The widget is structured as follows:
Select Folder button
Visualization options
Generate and Save buttons.
Opening files
To update or change the files used by the viewer, you must click the Select Folder button.
For a selected folder, it will select the latest available computation parameter file and the associated results. This means that if several computations have been run on the same file, only the most recent one will be taken into account. Therefore, if trajectories were computed previously but not during the last computation, it will not use the results from the previous run. The goal is to avoid mixing results with potentially different parameters.
In the console, you will see a message block like this:
Loading files from the 'YOUR_PATH' folder with the timestamp 20251216_163843.
File 'localizations' loaded successfully.
File 'localizations_filtered' loaded successfully.
File 'tracking' loaded successfully.
File 'tracking_filtered' loaded successfully.
File 'tracking-reconnected' loaded successfully.
File 'tracking_filtered_reconnected' loaded successfully.
File 'tracking_MSD' loaded successfully.
File 'tracking_MSD' loaded successfully.
File 'tracking_InstantD' loaded successfully.
File 'tracking_InstantD_filtered' loaded successfully.
Error loading file 'tracking_Fit' : [Errno 2] No such file or directory: 'C:\\Git\\palm-tracer\\palm_tracer\\_tests\\input/stack_PALM_Tracer/tracking_Fit-20251216_163843.csv'
Error loading file 'tracking_Fit_filtered' : [Errno 2] No such file or directory: 'C:\\Git\\palm-tracer\\palm_tracer\\_tests\\input/stack_PALM_Tracer/tracking_Fit_filtered-20251216_163843.csv'
Stack loaded successfully.(size: (10, 128, 256)).
It provides a status report of the file loading, and you can see which elements were not computed for this timestamp. Here, at 16:38:43 on December 16, 2025, all elements were computed and filtered except the fit on the trajectories (it indicates that it did not find the corresponding file).
Visualization options
Visualization options
The visualization options are fairly simple:
Point Size lets you define the diameter of points for the vector representation. This does not change the pixel size for localization, which will always be a 1-pixel square.
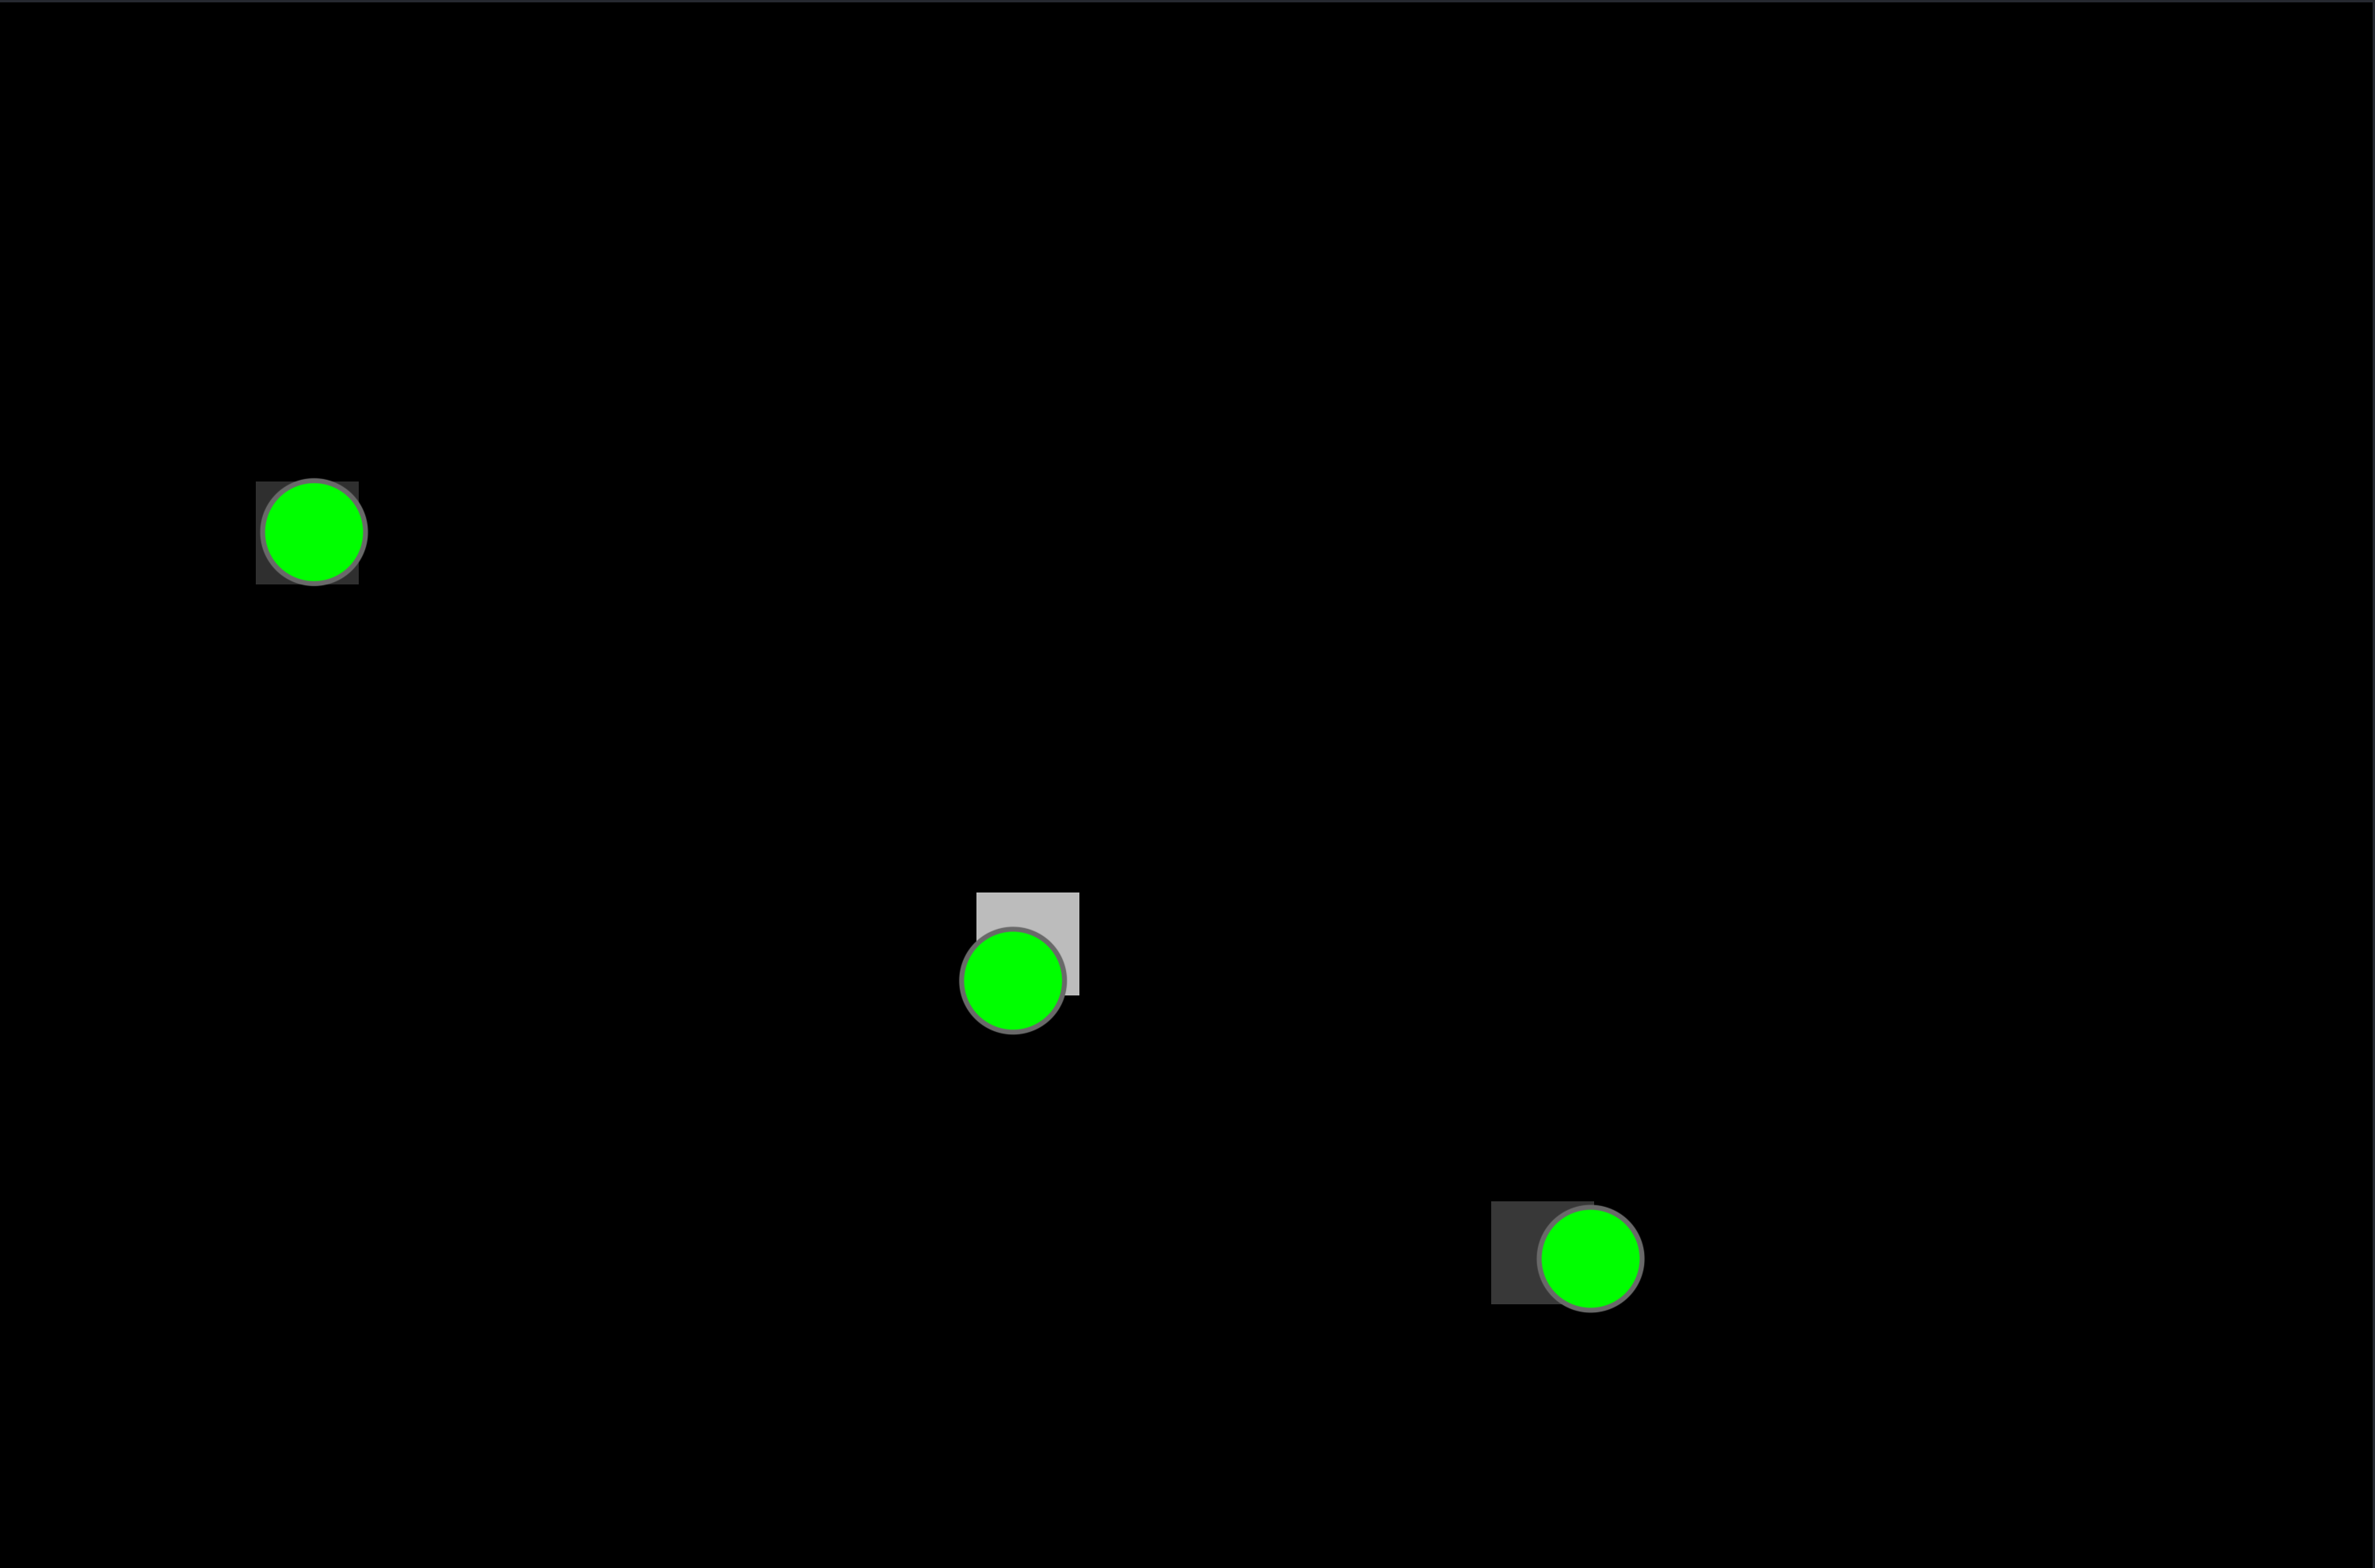
Vector points vs visualization
Upscale Ratio lets you define the scale-up factor of the final visualization relative to the acquisition size.
Visualization Type lets you define whether the visualization represents localizations or trajectories.
Color Source lets you define which localization/trajectory element will be used to set the brightness intensity of the point. For example, the total intensity of the detected molecule or the value of the uncertainty about its precise position (MSE).
PNG Color Map lets you define a colormap for the final generated image. By default, it is Grayscale for localizations and the Viridis map for trajectories. The choice is limited to perceptually uniform maps (‘viridis’, ‘magma’, ‘plasma’, ‘inferno’, ‘cividis’, ‘turbo’). (More details about colormaps here)
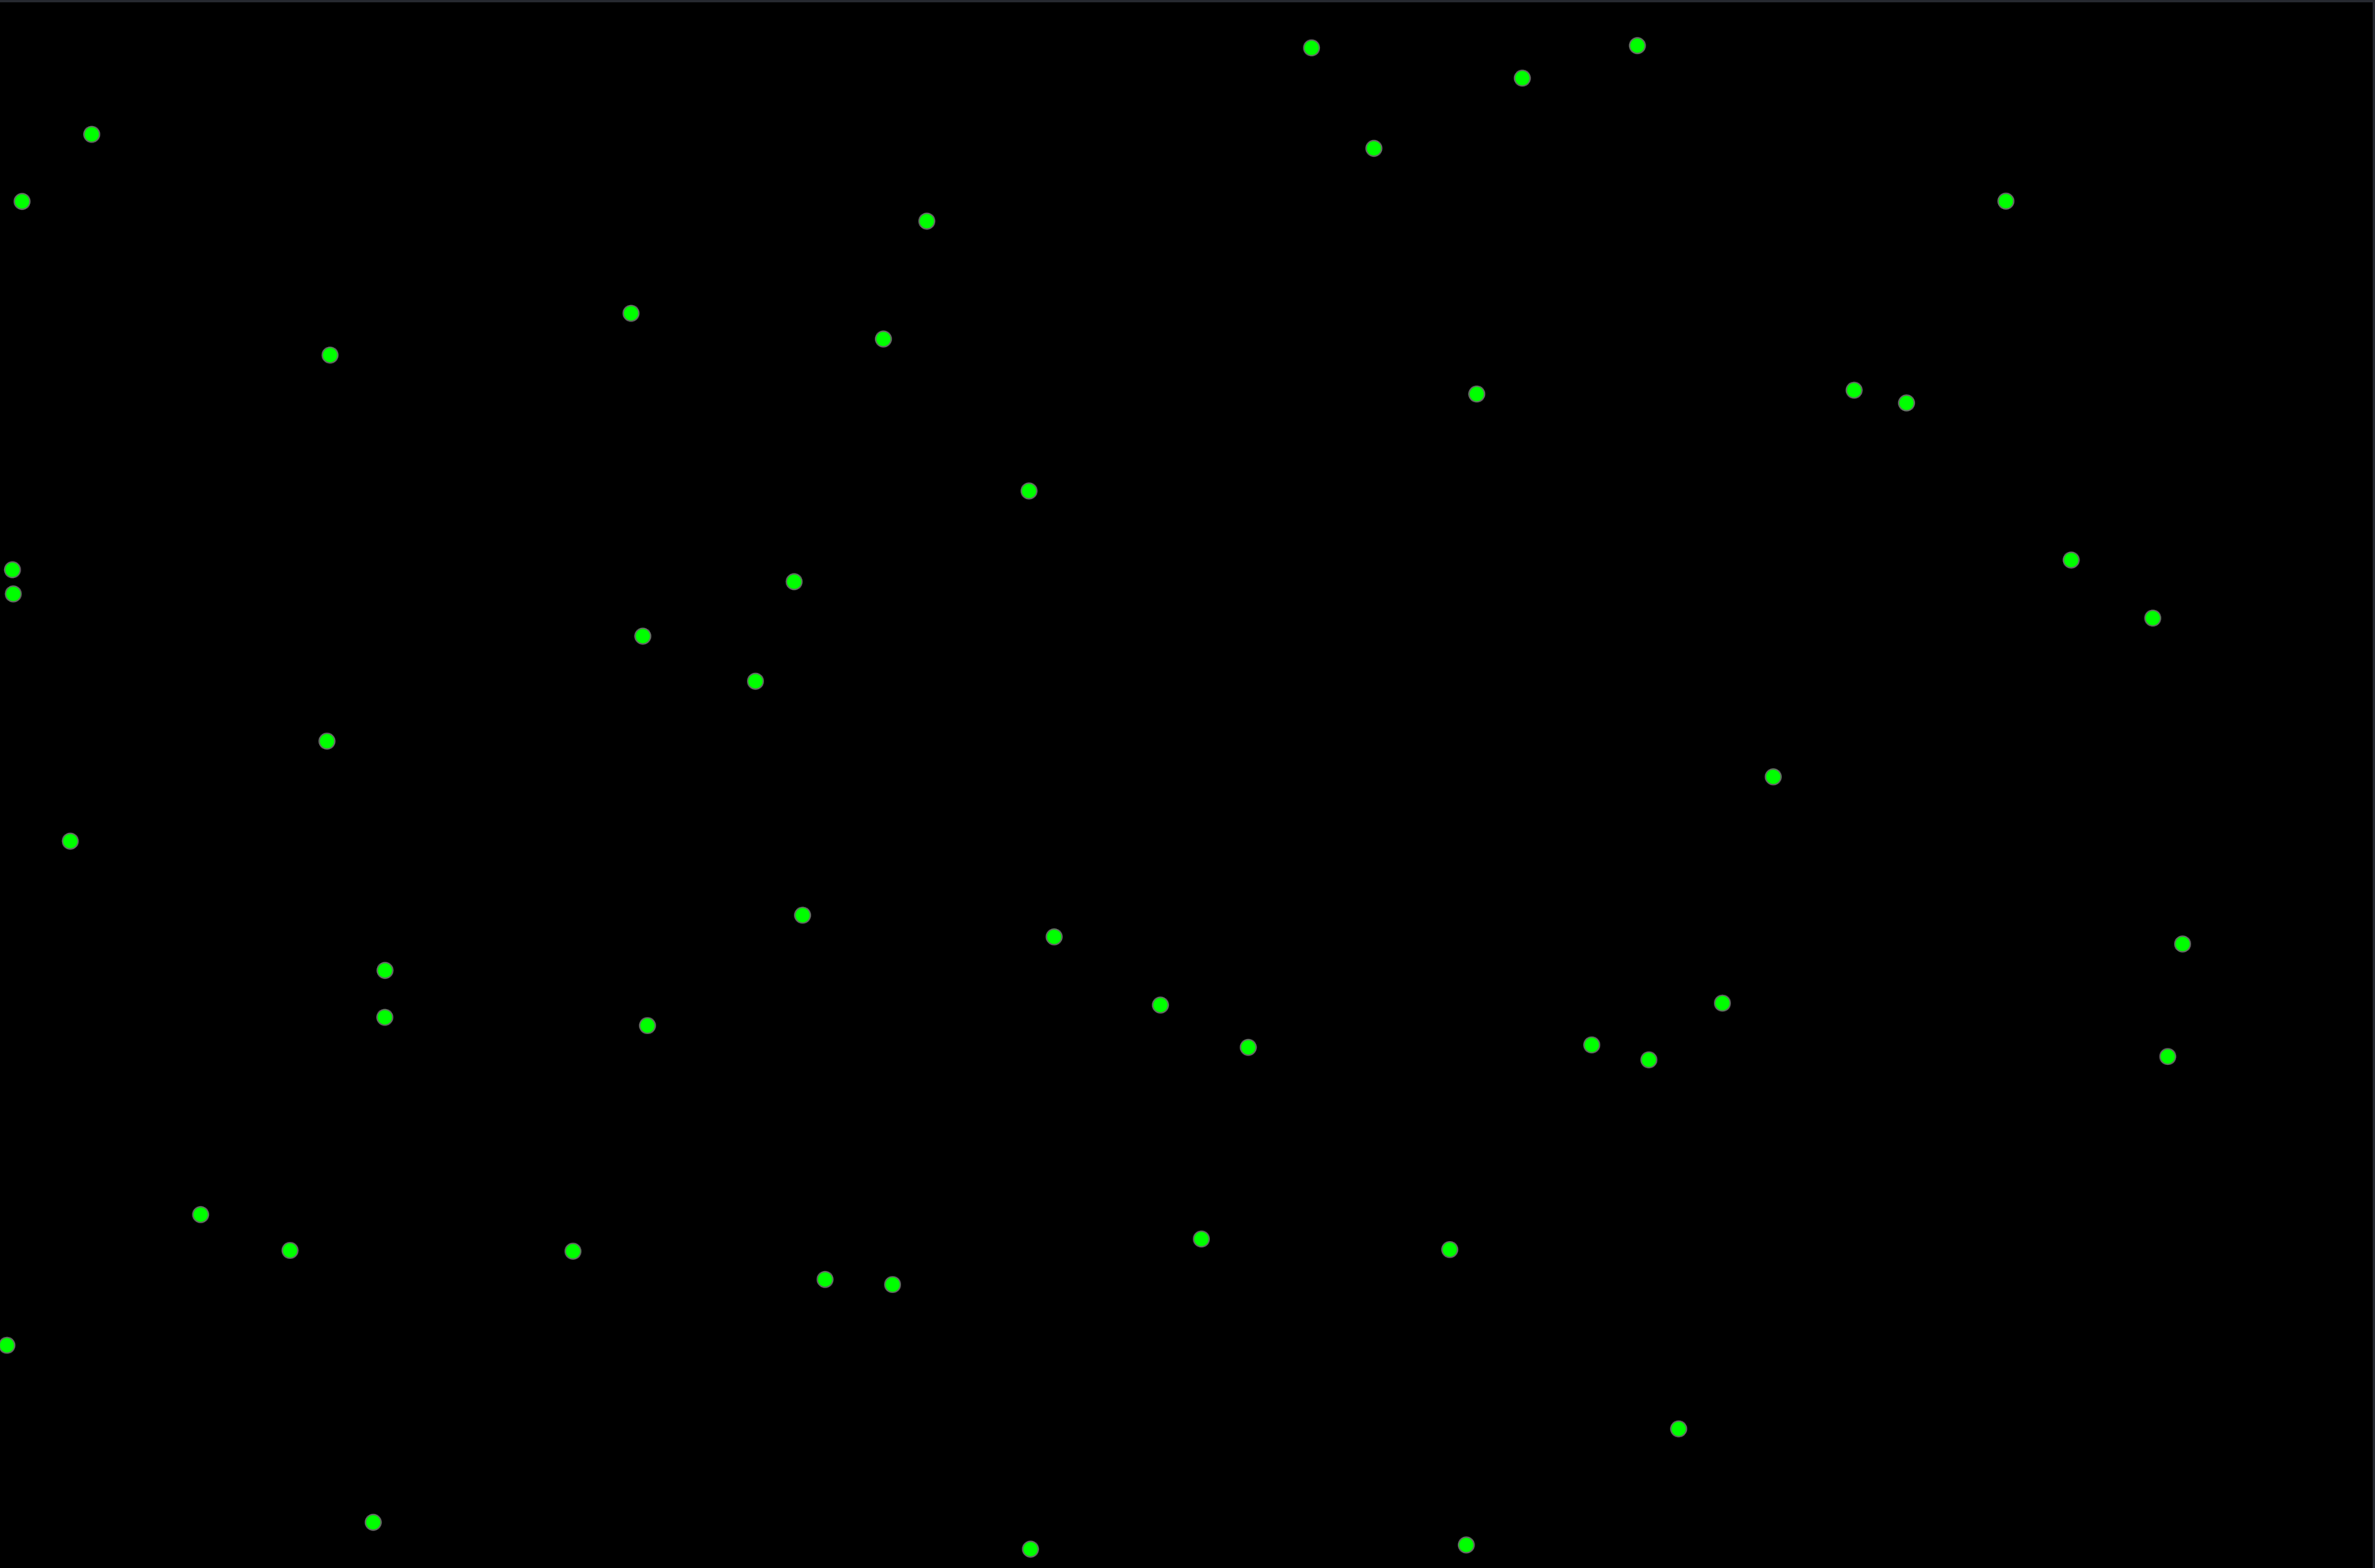
Vector display of localizations |
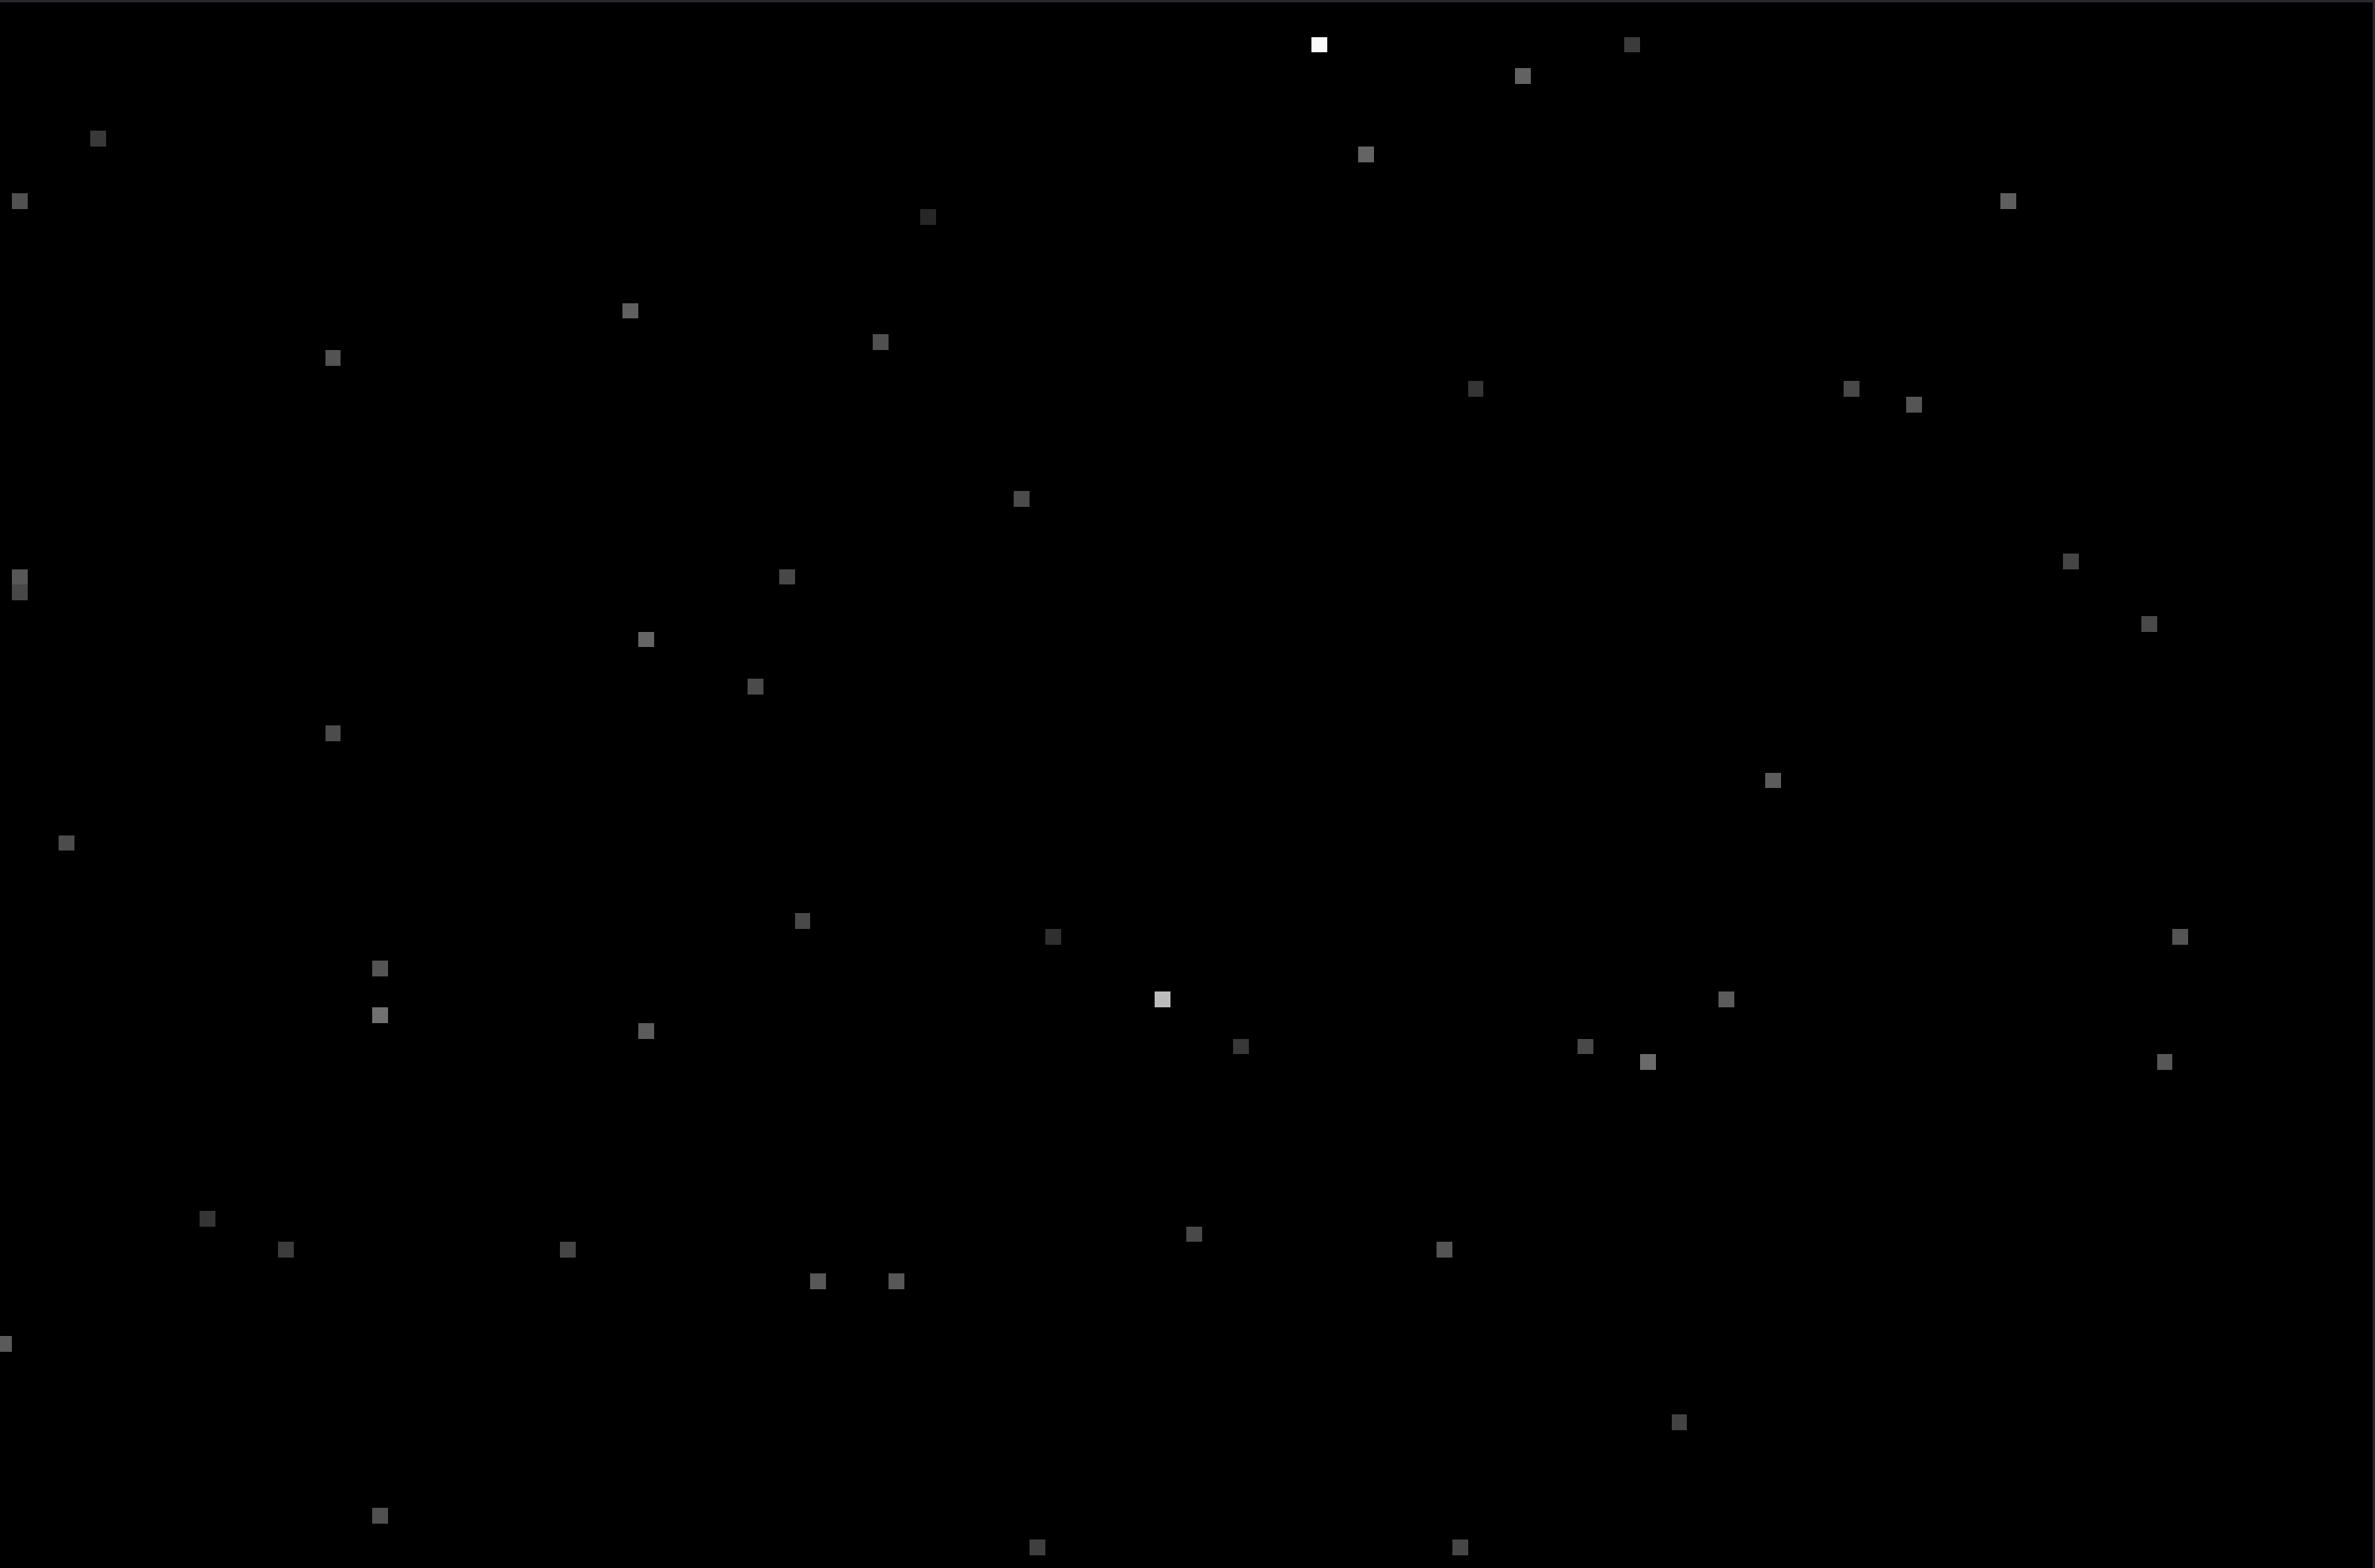
Display of localizations |
Vector display of trajectories |
Display of trajectories |
Generation and saving
The last two buttons are used to generate the visualization and the associated layers, and then to save if the current scale-up satisfies you.
Application messages
Messages can appear at any time in the console and in Napari notifications.
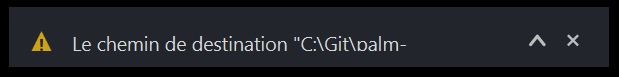
Napari notification
WARNING: Le chemin de destination "VOTRE_CHEMIN" n'est pas valide.
This message indicates that the selected folder does not exist (a typing error is the most common reason). This message can appear when opening, because it tries to open the current path by default. When you launch the viewer from the PALMTracer plugin, by default it will select the folder of the current image and start a generation. It can also appear when you press Generate.
WARNING: Aucune Pile de chargée.
This message indicates that the selected folder containing the results is correct, but that the stack is not in the location expected by the standard PALMTracer naming convention. This happens if you only retrieved the results folder or moved it. It currently needs the original stack in order to retrieve the original file dimensions. This may be modified later to read the meta file containing this information, if applicable.
WARNING: Aucun fichier de localisation disponible.
This message indicates that in the selected folder and for the latest parameter file, no localization was found. It can appear when you press Generate.
WARNING: Aucun fichier de trajectoires disponible.
This message indicates that in the selected folder and for the latest parameter file, no trajectory was found. It can appear when you press Generate.
INFO: Sauvegarde du fichier image.
This message indicates that the visualization result file has been saved. It can appear when you press Save (if generating a visualization was previously successful).