3D Viewer
Launch
Open a terminal or command prompt (
PowerShellon Windows) in the folder where you extracted the project files. Example forC:\palm-tracer. Open the terminal and type the following command:cd C:\palm_tracer, then press Enter.Make sure the virtual environment is activated if you are using it.
Launch Napari with the command:
napari
Note
If you did not create a virtual environment, Napari can be launched from anywhere.
Enable the plugin in Napari:
Note
It is possible to launch Napari directly with the plugin using the command: napari -w palm-tracer
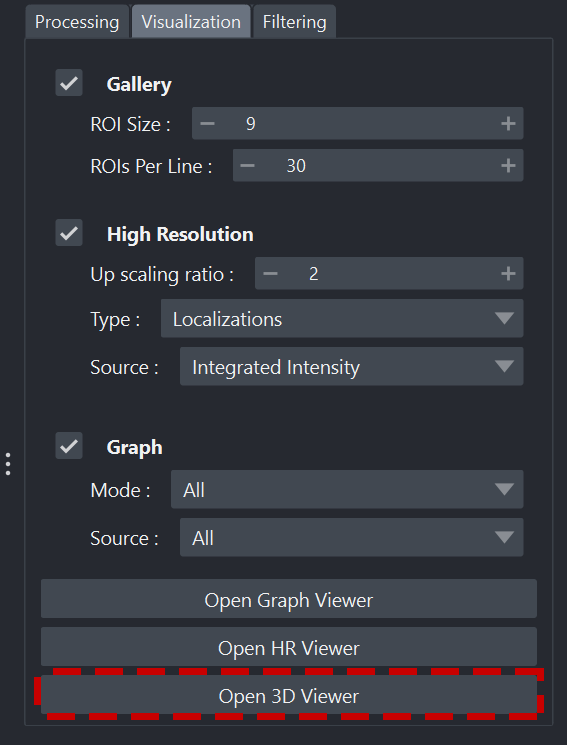
In the Visualization tab of PALM Tracer, there is a button to launch the 3D viewer: Open 3D Viewer. It is also possible to open it directly from the Napari menu:
Napari layers panel
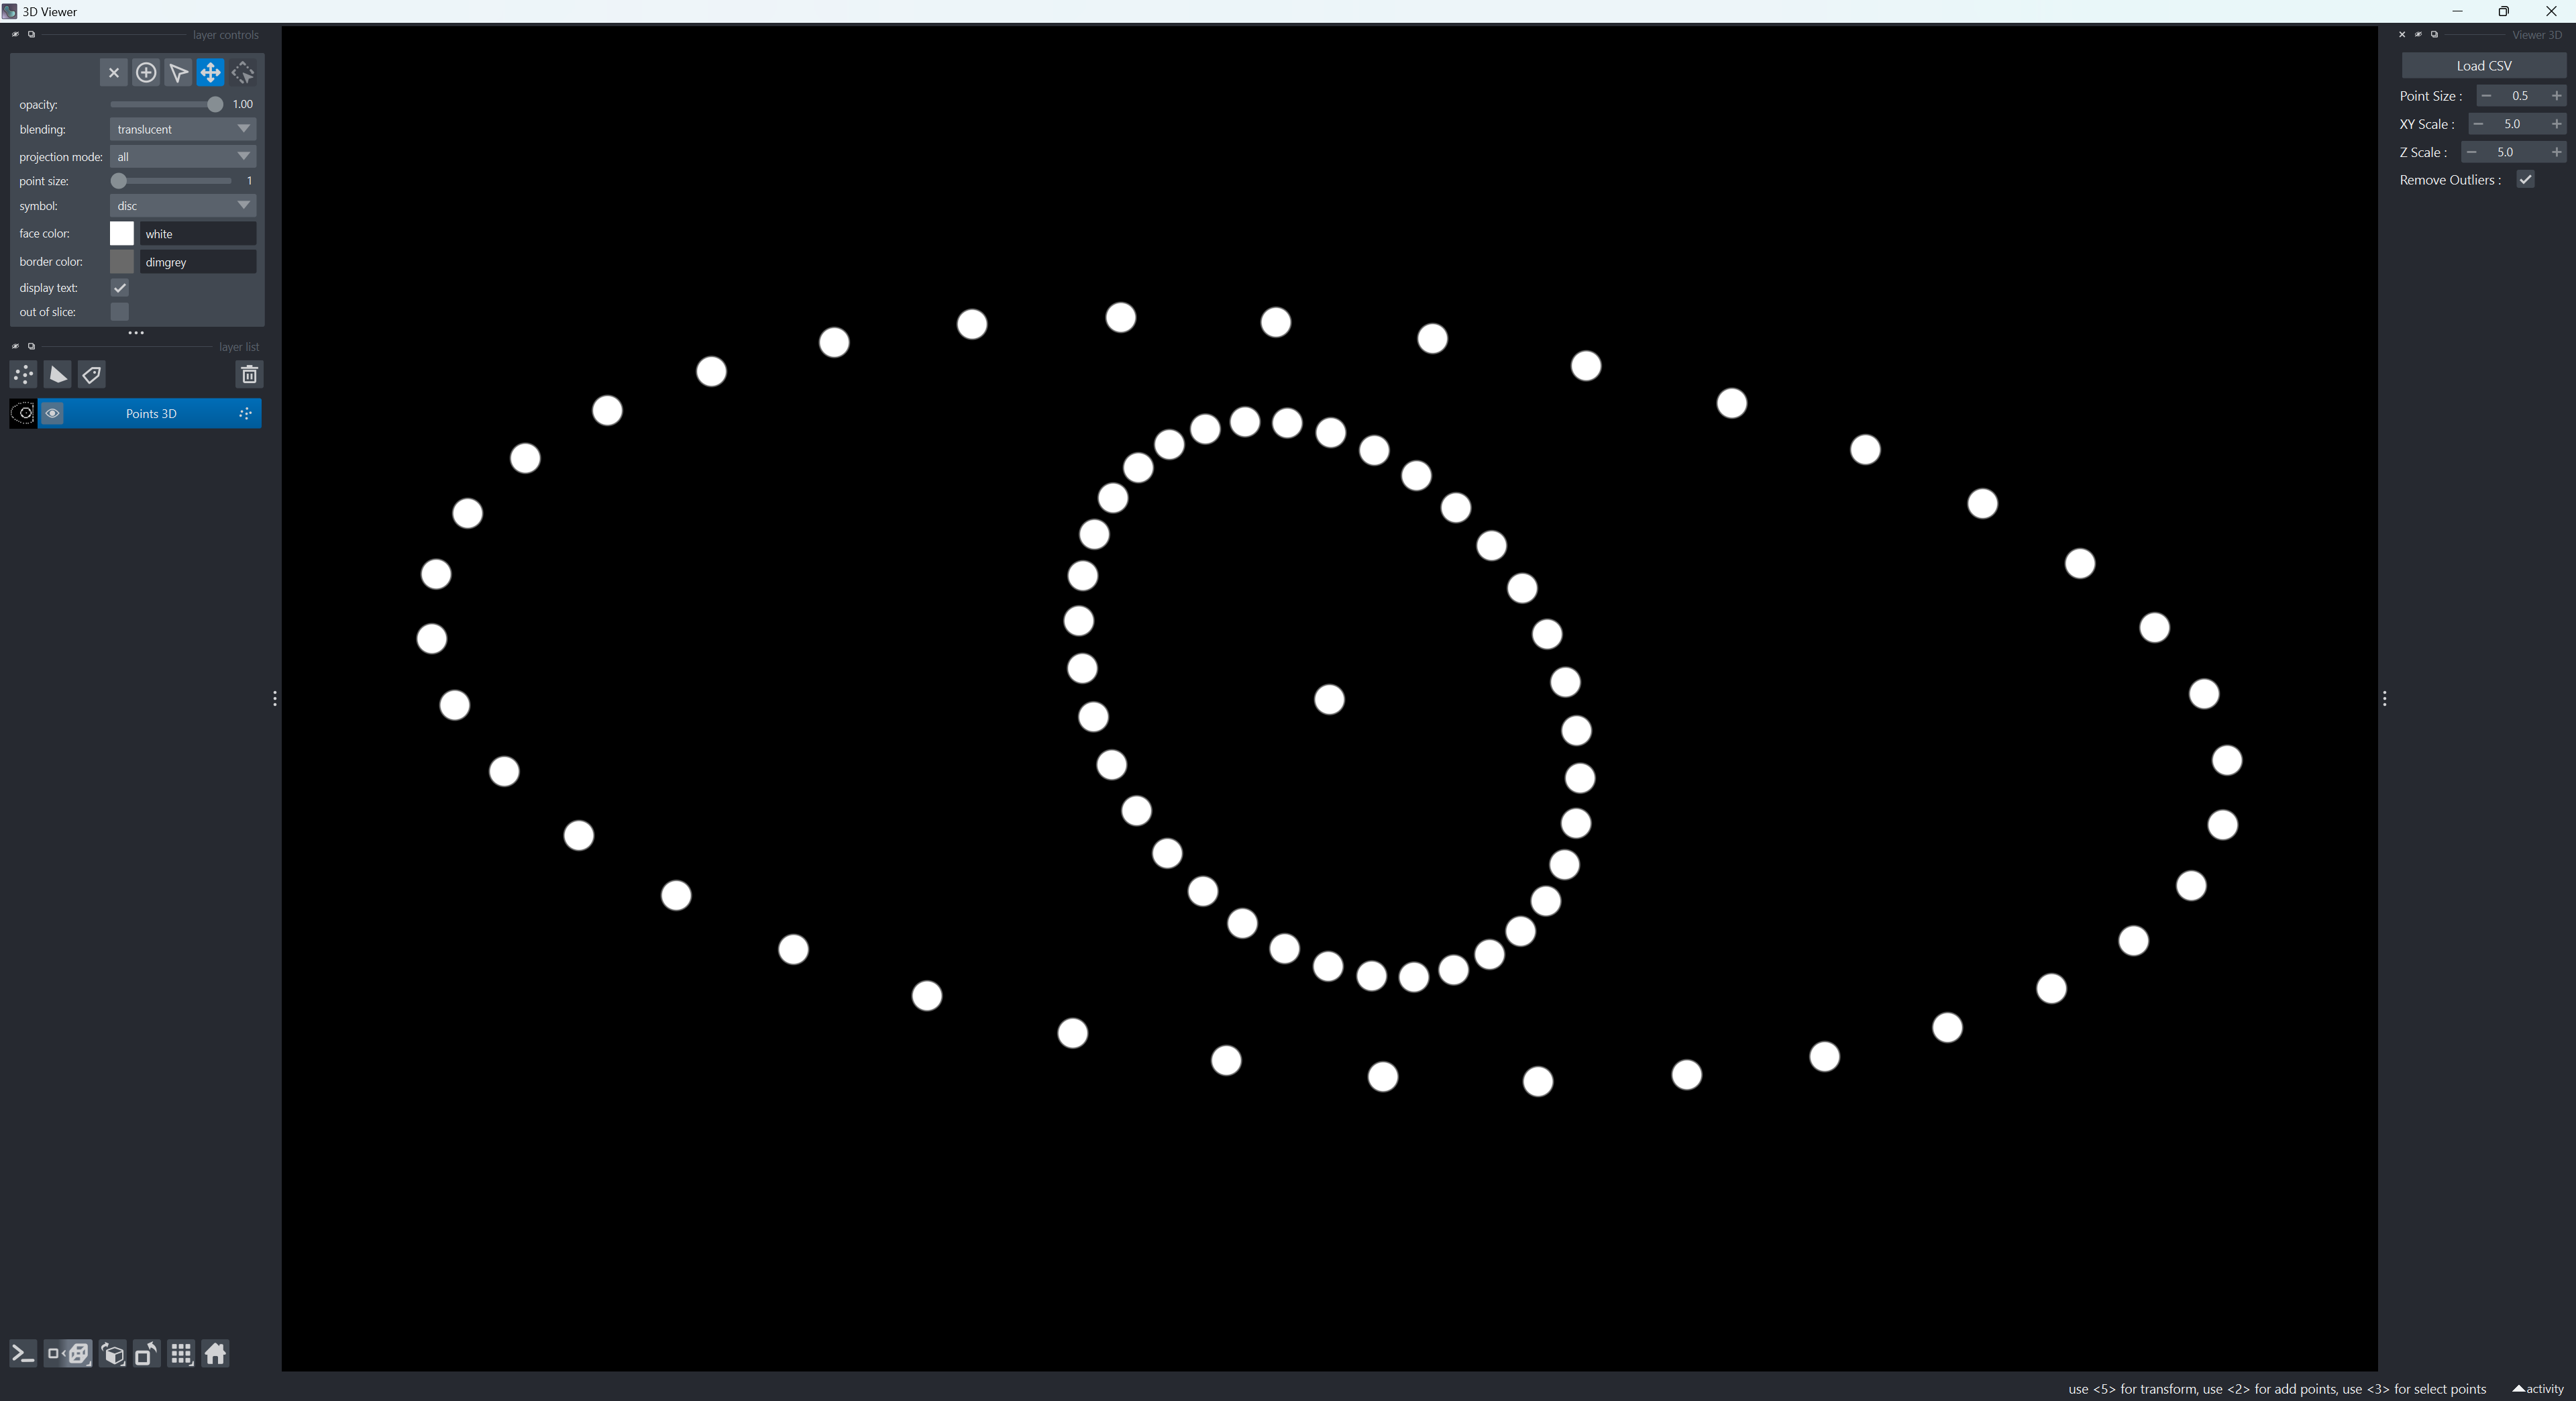
Interface organization
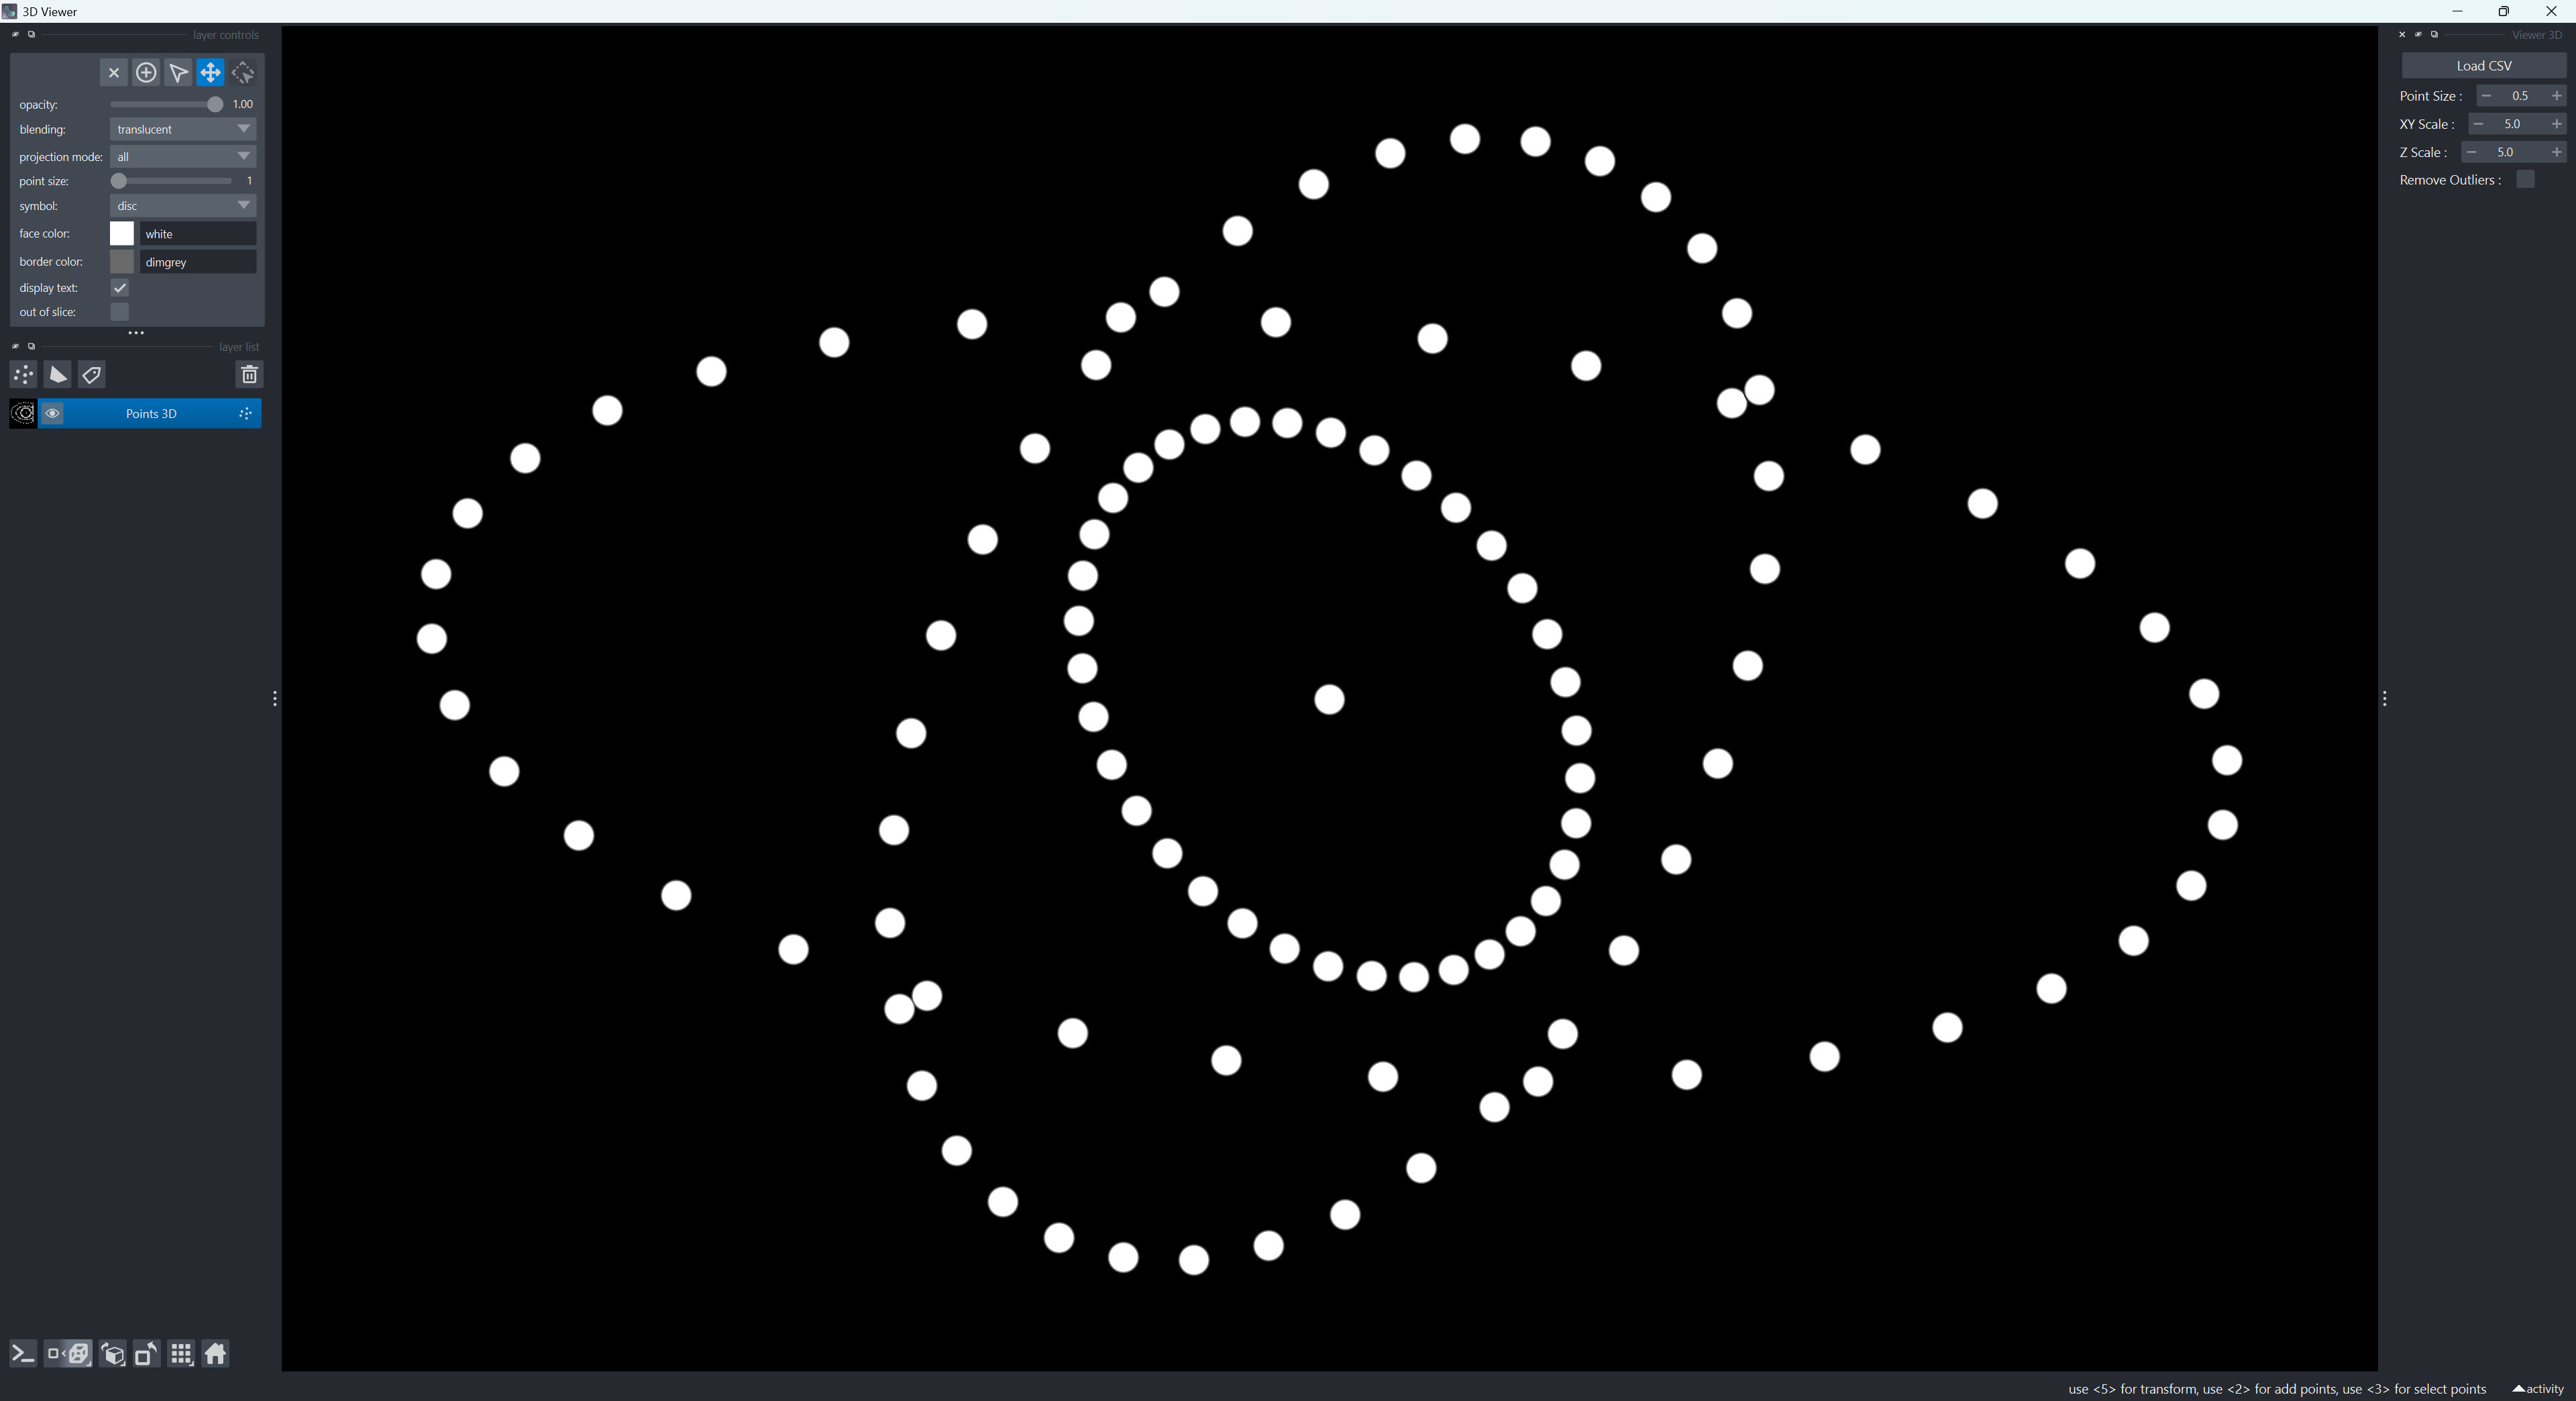
Overview of Napari with the 3D Viewer widget
The Napari interface with the 3D viewer is organized into three main panels:
On the left: the layers panel (Layers)
In the center: the visualization window
On the right: the viewer widget
Layers panel
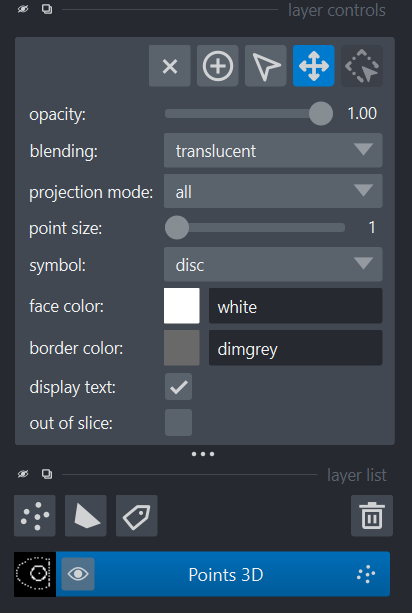
Napari layers panel
The layers panel is the area where all visual elements generated by the Napari widget appear:
Detected points (in floating-point precision and infinitely zoomable).
Visualization panel
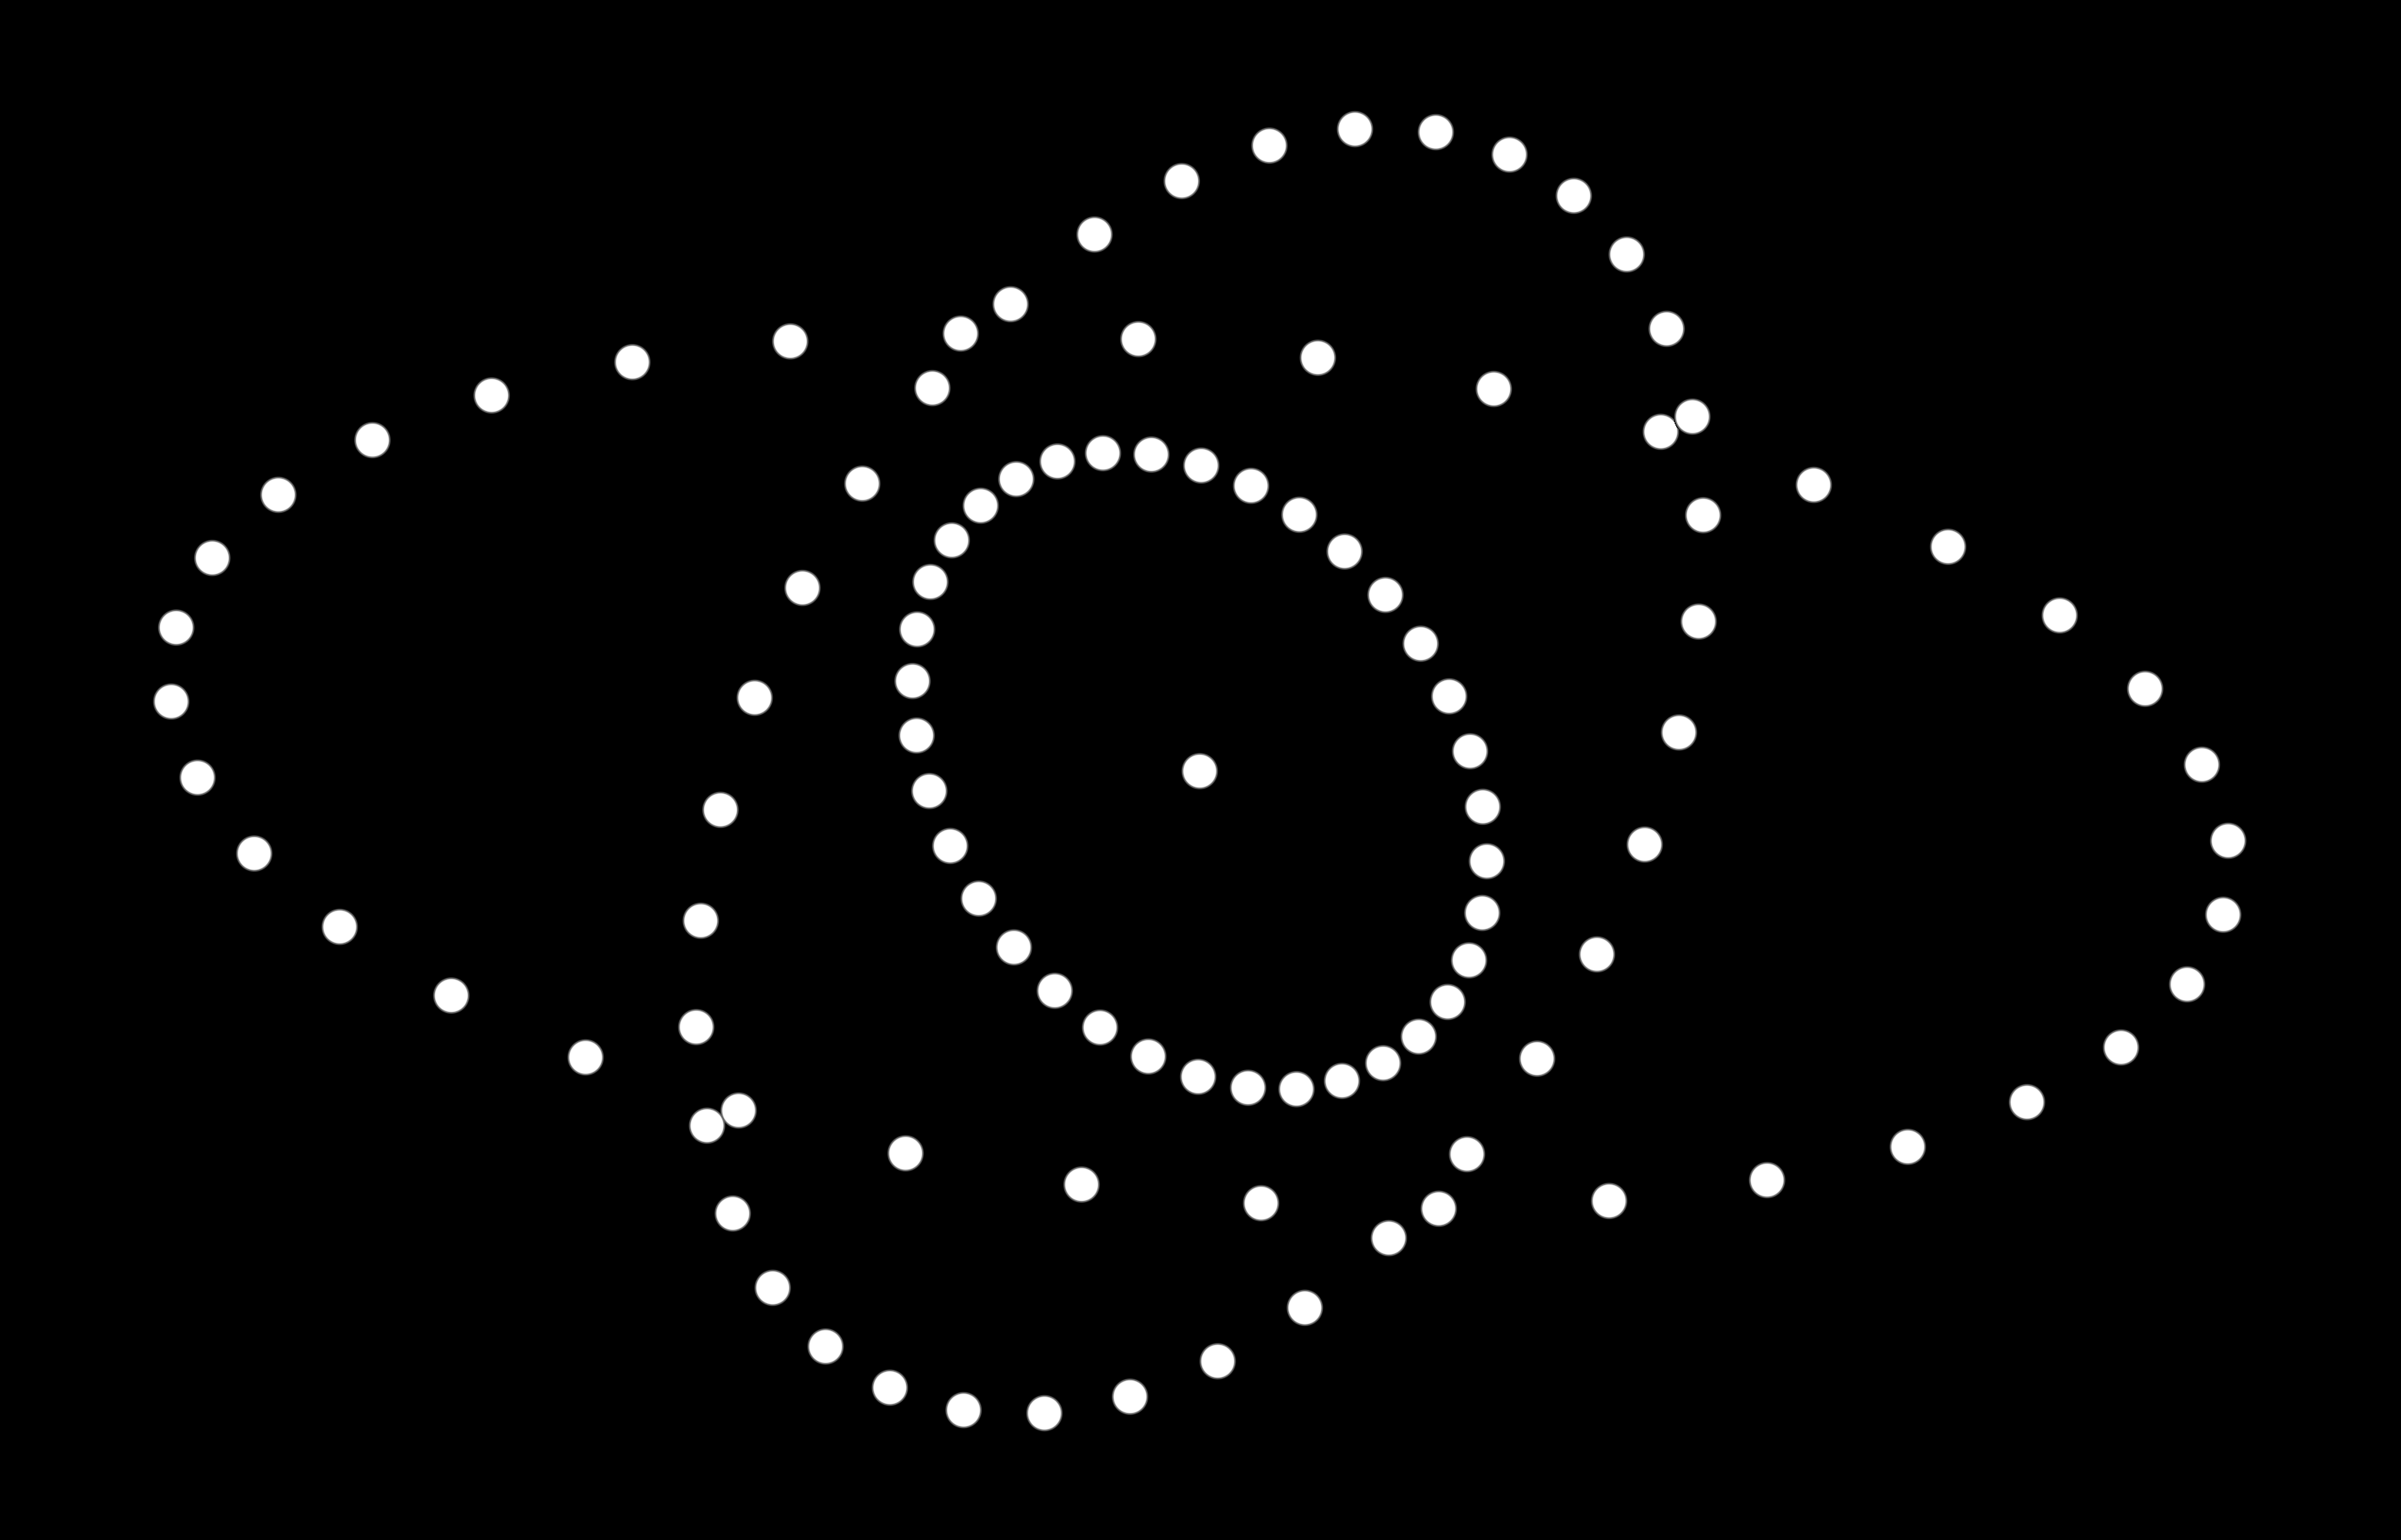
Napari visualization panel
The central area of Napari displays the data. You can:
Zoom (mouse wheel)
Rotate (left mouse button held down)
Widget panel
Napari widget panel
The right panel contains the main viewer widget.
The widget is structured as follows:
Load CSV button
Visualization options
File opening
To update or change the file used by the viewer, click the Load CSV button. To be valid, the file must contain at least the X, Y, Z, and Integrated Intensity columns.
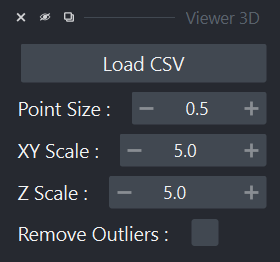
Visualization options
Visualization options
The visualization options are fairly simple:
Point Size allows you to define the diameter of the points for vector representation.
XY Scale and Z Scale allow you to define different scales for the XY plane and the Z axis. This is useful if you have different units, such as pixels for X and Y and nanometers for Z.
Remove Outliers allows you to hide points whose integrated intensity is 0. This marker can be used in case of an error during Gaussian fitting. For example, the point is not removed, but its intensity set to 0 makes it easy to separate during file reading for later analyses.
Outlier removal
Application messages
Messages may appear at any time in the console and in Napari notifications.
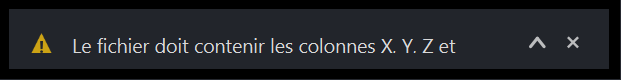
Napari notification
WARNING: Le fichier doit contenir les colonnes X, Y, Z et Integrated Intensity.
This message indicates that the selected file does not contain the four columns required for visualization.