User manual
This guide describes the use of PALMTracer, a Napari plugin, dedicated to PALM/STORM data analysis and localization processing, including preview, detection, tracking, 2D/3D visualization, and result filtering.
PALMTracer operates as a widget integrated into the Napari interface, providing a set of tools organized into tabs: Processing, Visualization, and Filtering.
Launch
Open a terminal or command prompt (
PowerShellon Windows) in the folder where you extracted the project files. Example forC:\palm-tracer. Open the terminal and type the following command:cd C:\palm_tracer, then press Enter.Make sure the virtual environment is activated if you are using one.
Launch Napari with the command:
napari
Note
If you did not create a virtual environment, Napari can be launched from anywhere.
Enable the plugin in Napari:
Note
It is also possible to launch Napari directly with the plugin using the command: napari -w palm-tracer
Interface organization
The Napari interface with PALMTracer is organized into three main sections:
On the left: the layers panel (Layers)
In the center: the visualization window
On the right: the PALMTracer widget
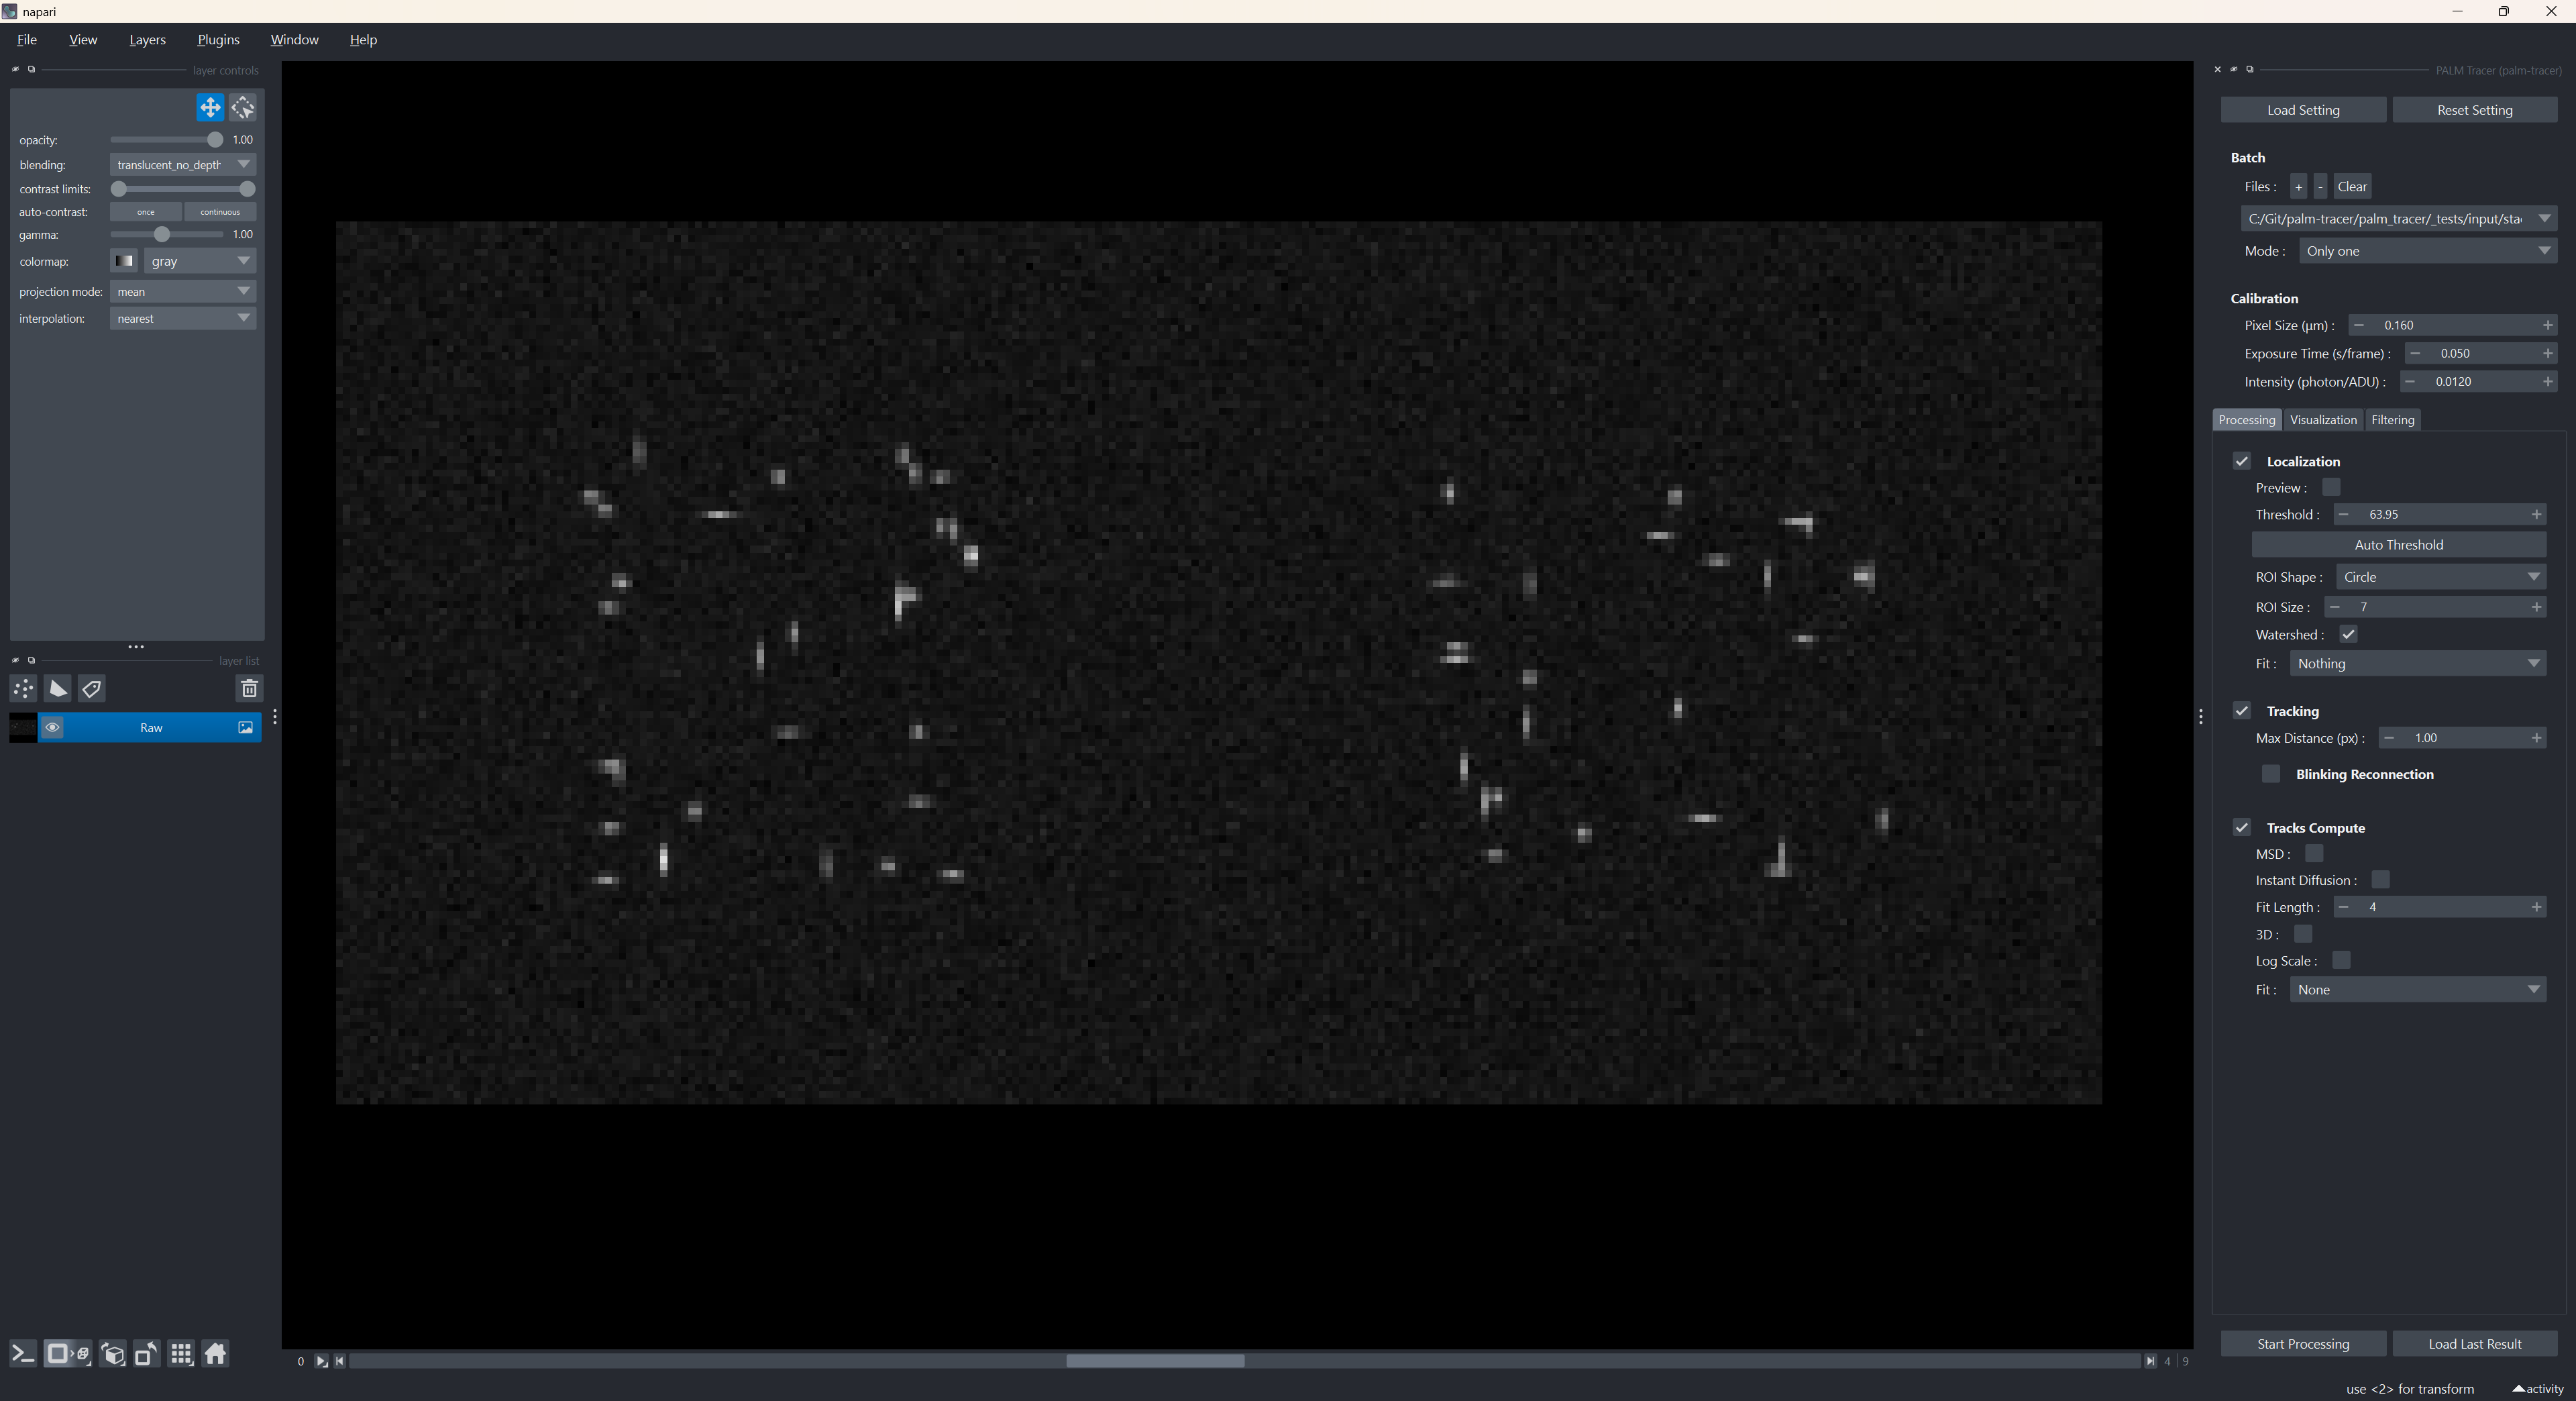
Overview of Napari with the PALMTracer widget
Layers panel
The layers panel is the area where all visual elements generated by PALMTracer appear:
Raw image (Raw)
Detected points (Points Past / Present / Future)
Localization ROIs
High-resolution visualization
Trajectories (Tracks)
3D views or external plots
Main features:
Show / hide a layer
Change transparency
Change the colormap
Reorder layers
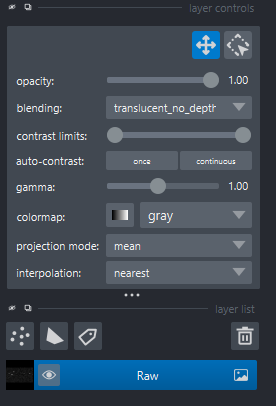
Napari layers panel
Visualization panel
The central area of Napari displays the data. You can:
Zoom (mouse wheel)
Move around (left mouse button held)
Change the Z plane using the dimension bar
Adjust contrast
PALMTracer automatically updates this area each time a file is changed or during preview.
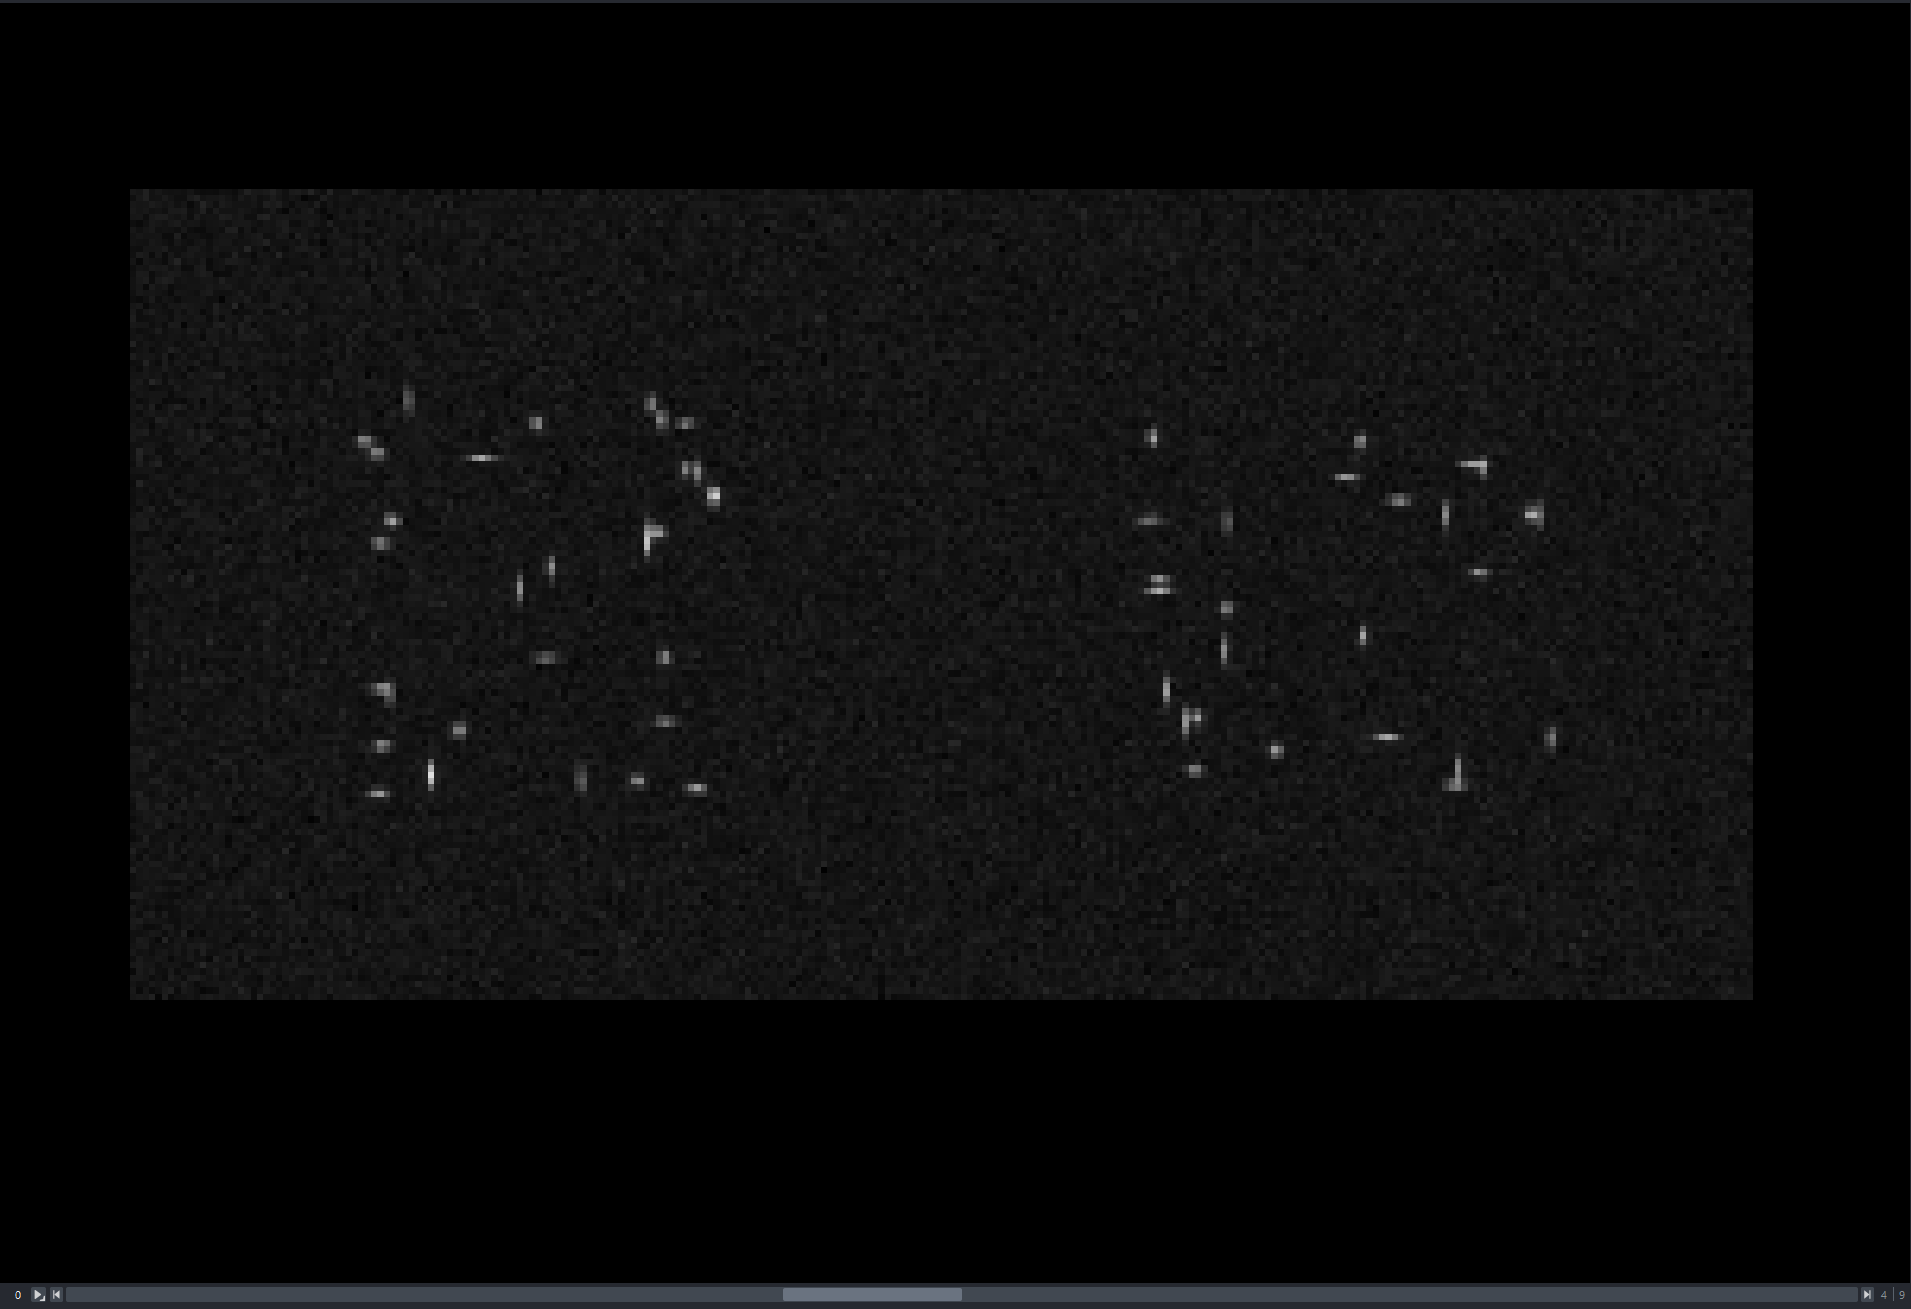
Napari visualization panel
PALMTracer panel
The right panel contains the main PALMTracer widget.
The widget is structured as follows:
- Top section:
Buttons Load Setting / Reset Setting
Batch (file management)
Calibration
- Tabs:
- Processing
Localization parameters
Tracking parameters
Trajectory computation parameters
Start Processing button (processing in a separate thread)
- Visualization
ROI gallery.
High-resolution visualization
3D viewer
Graph viewer
- Filtering
Localization and track filtering parameters
Buttons Start Processing / Load Last Result
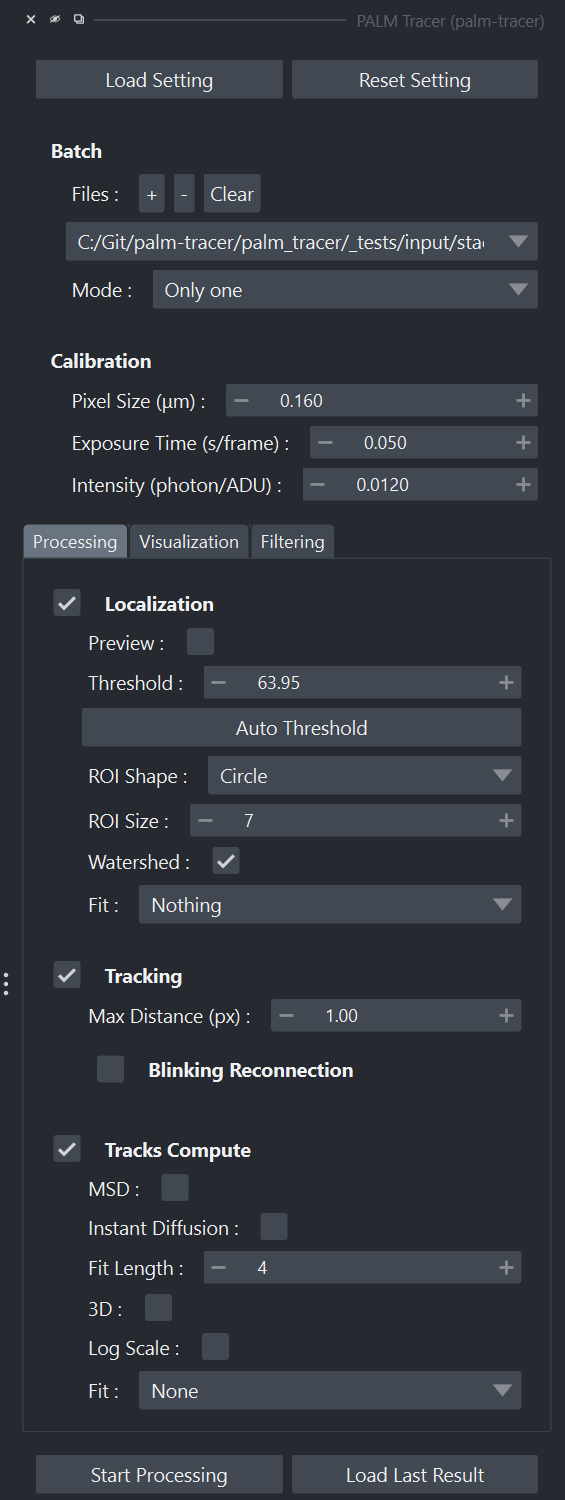
Napari widget panel
Opening files
In the PALMTracer panel, click the + button in the Batch section.
Select a
.tifor.tifffile.You can open multiple files successively: they will appear in a drop-down list.
The Mode parameter allows you to define the behavior during processing:
“Only one”: only one file is analyzed.
“Each File separately”: each file is analyzed independently.
“All in One”: all files are combined and analyzed as a single dataset.
When a file is selected, PALMTracer:
Clears the previous layers.
Automatically loads the file into a Raw layer.
Updates the preview if it is enabled.
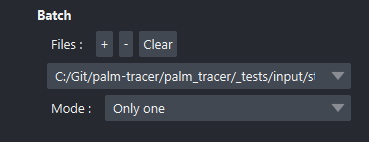
Batch parameters
Acquisition calibration
In the Calibration section, fill in:
Pixel size in micrometers (µm).
Exposure time in seconds per frame.
Light intensity in photons per analog-to-digital units (ADU).
These parameters are used to:
Convert raw intensities.
Calibrate trajectories into physical units.
Enable consistent physical measurements, in particular for the computation of diffusion coefficients.
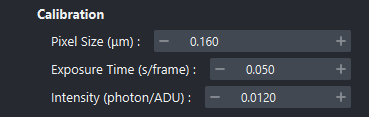
Calibration parameters
Processing tab
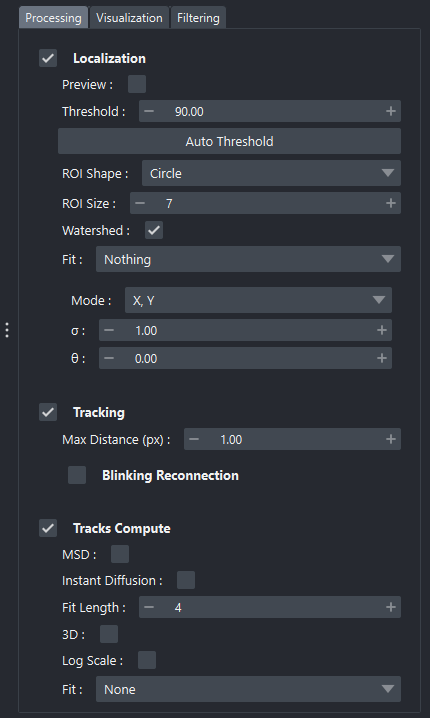
The Processing tab groups all parameters related to the main processing: localization and optional molecule tracking, followed by computations on trajectories.
- It is composed of three modules:
Localization
Tracking
Trajectory computations
Processing tab of the widget
Localization
The Localization section allows configuration of parameters that directly influence molecule detection on each image.
- The most common parameters include:
Preview: if enabled, runs detection in real time on the previous, current, and next image (more information here).
Threshold: intensity threshold used to isolate molecular candidates. A Auto button can automatically estimate an optimal threshold from the current image (more information here).
ROI Shape: shape of the region of interest during preview (circle or square); however, calculations are always performed on a square ROI.
ROI Size: size of the window extracted around each detection.
Watershed: enables/disables a pre-processing step to separate nearby detections.
Fit: fitting method used to precisely localize molecules (None, Gaussian, Spline) (more information here).
Tracking
The Tracking section is used to link detections between frames in order to reconstruct trajectories (if your acquisition is suitable for this analysis).
- Parameters may include:
Max Distance: maximum distance in pixels between two frames.
- Blinking ReconnectionReconnection parameters in case of blinking.
Mode: point motion model (immobile, diffusive, linear).
Max Duration: maximum blinking duration in number of frames.
Max Speed: maximum point speed in µm/frame.
Note
Note: tracking is performed during full processing, not during preview.
Trajectory computations
- This section allows applying different computations to the reconstructed trajectories:
MSD: (Mean Squared Displacement): computation of the MSD per trajectory and over successive frames.
Instant Diffusion: computation of instantaneous diffusion per trajectory and over successive frames.
Fit Length: length of the initial computation window for generic metrics and instantaneous diffusion.
3D: whether or not to use the Z coordinate in computations.
Log Scale: whether or not to use a logarithmic scale for results.
Fit: fitting method for the trajectory motion.
Visualization tab
This tab groups the tools needed to graphically visualize results generated by Processing.
- It includes:
Gallery: tools that allow creating a
.tifimage containing all detections in sequence by defining the region of interest size and the number of detections per rows/columns. If the number of detections exceeds the defined number of rows × columns, a new frame is added to the result. Example: for an acquisition of 1000 detections, by defining 10 rows/columns and a region of interest size of 9, the result will be a 90×90 pixel image per frame, with 10 frames.High Resolution: one or more high-resolution images are generated according to the selected upscaling factor and the chosen source used to define intensity.
Graph Viewer: opens a window dedicated to statistical representations. (more information here)
HR Viewer: opens a window dedicated to high-resolution representations. (more information here)
3D Viewer: opens a window dedicated to 3D representations. (more information here)
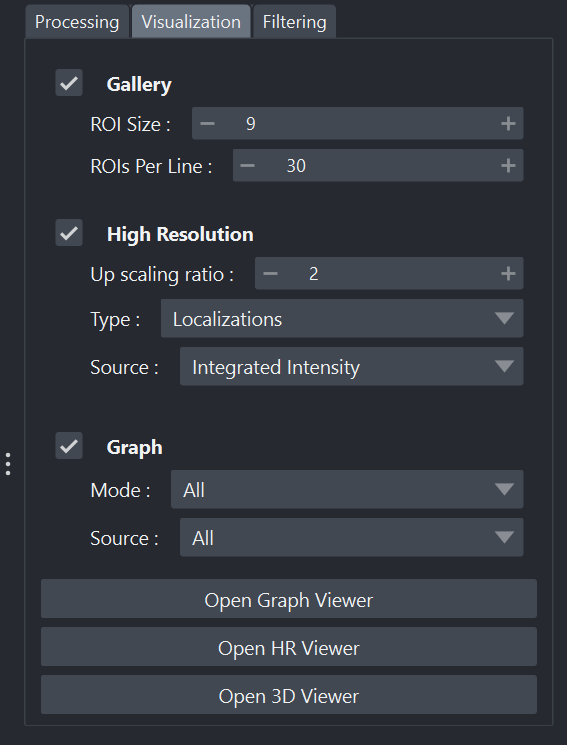
Visualization tab of the widget
Filtering tab
The Filtering tab allows selecting or excluding points or trajectories according to various statistical or geometric criteria.
Filters allow defining minimum and maximum thresholds for various parameters, such as limiting the frames to work on, or using criteria based on properties of points or trajectories.
- Once applied, filters affect:
High Resolution visualization
the displayed tracks
the plots in the Graph Viewer
any data exports (if the Save filtered option is enabled).
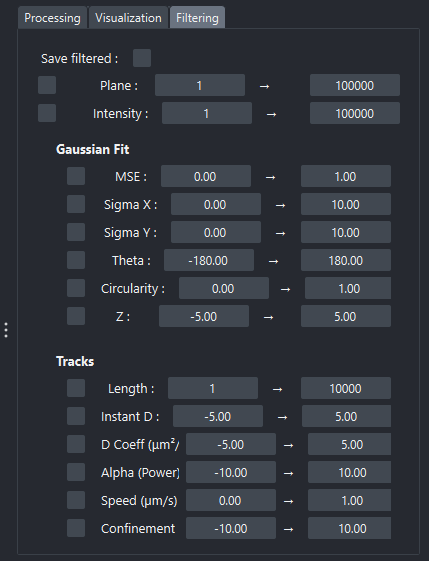
Filtering tab of the widget
Note
Notes: filters do not modify raw data or internal processing results. They are applied dynamically during visualization or export.
Note
The filter on X or Y displays a red rectangle in the Napari visualization to dynamically identify the filtered area.
FAQ
1. Why does Napari close when launching the plugin?
Napari may close immediately after launching the PALMTracer plugin. This is usually due to Napari being overloaded and having difficulty handling the memory required to open the plugin. You should try opening the PALMTracer plugin again. If the problem persists, try deleting the PALMTracer configuration file located in the user directory (usually C:\Users\YOUR_USER_NAME\.palm_tracer).
2. The interface is huge.
This is probably due to Windows automatic scaling settings for Qt applications. Refer to Step 6 of the installation section to disable this feature.
3. In what order does it perform the computations?
When pressing Start Processing, a pipeline starts; the description of this pipeline is available here).
3. Where can I find more help?
Check the official Napari documentation or contact the project support.